Aktuálne formácie

Formácie sú grafické modely, ktoré v grafe vytvára pohyb ceny. Jedným z postulátov technickej analýzy je, že história (pohyb ceny) sa opakuje. Znamená to, že pohyby ceny sú v rovnakých situáciách často podobné, čo umožňuje s vysokou pravdepodobnosťou predpovedať ďalší vývoj situácie.
Služba Aktuálne formácie od InstaForexu sa ľahko používa. Vďaka nej sa dozviete o aktuálnych zmenách na trhu a budete tak môcť včas zareagovať na signály trhu. Táto služba vám vždy prinesie informácie o najnovších a najdôležitejších formáciách každého páru v ľubovoľnom časovom rámci.
Bullish Symmetrical Triangle
was formed on 19.03 at 18:02:02 (UTC+0)
signal strength 3 of 5
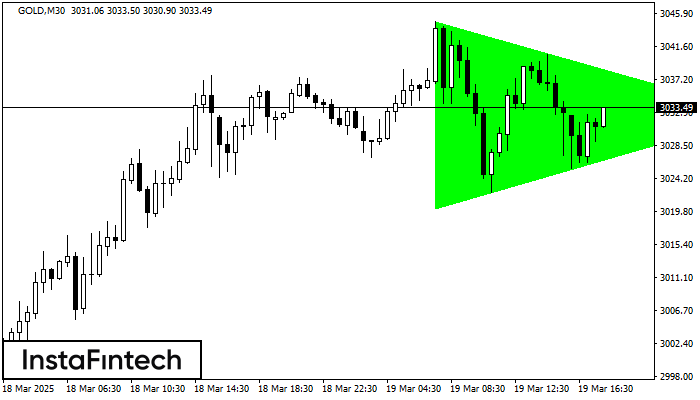
According to the chart of M30, GOLD formed the Bullish Symmetrical Triangle pattern, which signals the trend will continue. Description. The upper border of the pattern touches the coordinates 3044.87/3032.56 whereas the lower border goes across 3020.18/3032.56. The pattern width is measured on the chart at 2469 pips. If the Bullish Symmetrical Triangle pattern is in progress during the upward trend, this indicates the current trend will go on. In case 3032.56 is broken, the price could continue its move toward 3032.86.
Pozrite si tiež
- All
- All
- Bullish Rectangle
- Bullish Symmetrical Triangle
- Bullish Symmetrical Triangle
- Double Bottom
- Double Top
- Double Top
- Triple Top
- Triple Top
- Triple Top
- Triple Top
- All
- All
- Buy
- Sale
- All
- 1
- 2
- 3
- 4
- 5
बियरिश आयत
was formed on 10.04 at 16:45:45 (UTC+0)
signal strength 2 of 5
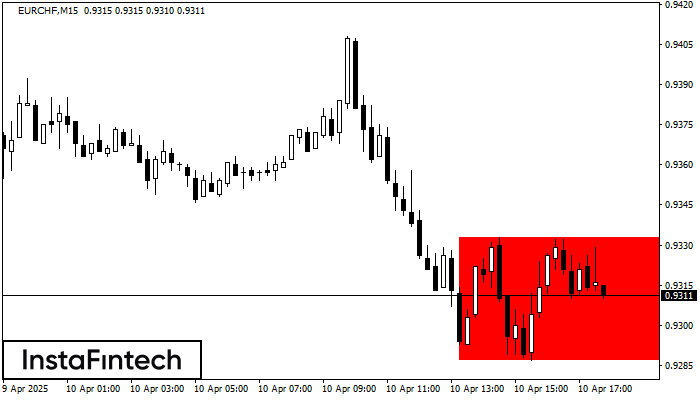
M15 के चार्ट के अनुसार, EURCHF से बियरिश आयत बना जो प्रवृत्ति निरंतरता का पैटर्न है। पैटर्न निम्न सीमाओं के भीतर समाहित है: निचली सीमा 0.9287 – 0.9287 और ऊपरी
M5 और M15 समय सीमा में अधिक फाल्स एंट्री पॉइंट्स हो सकते हैं।
Open chart in a new window
डबल बॉटम
was formed on 10.04 at 16:45:34 (UTC+0)
signal strength 2 of 5
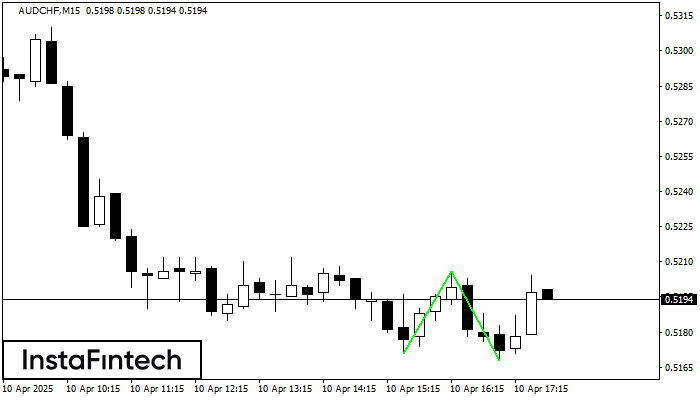
डबल बॉटम पैटर्न AUDCHF M15 पर बना है; ऊपरी सीमा 0.5206 है; निचली सीमा 0.5168 है। पैटर्न की चौड़ाई 35 अंक है। ऊपरी सीमा 0.5206 के टूटने के मामले में
M5 और M15 समय सीमा में अधिक फाल्स एंट्री पॉइंट्स हो सकते हैं।
Open chart in a new window
डबल टॉप
was formed on 10.04 at 16:00:14 (UTC+0)
signal strength 3 of 5
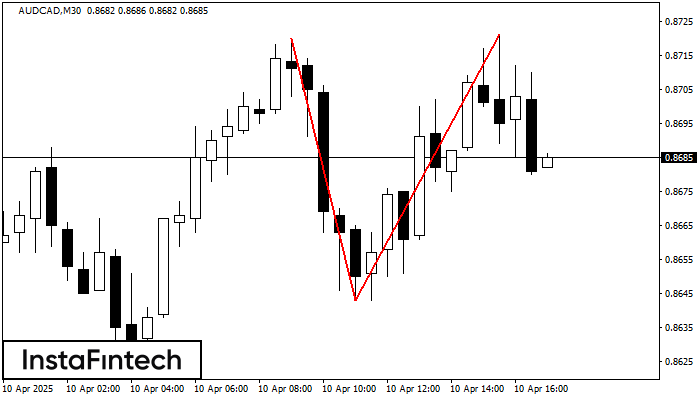
AUDCAD M30 के चार्ट पर डबल टॉप रीवर्सल पैटर्न बना है। विशेषताएं: ऊपरी सीमा 0.8721; निचली सीमा 0.8643; पैटर्न की चौड़ाई 78 पॉइंट्स। संकेत: निचली सीमा के टूटने से 0.8613
Open chart in a new window