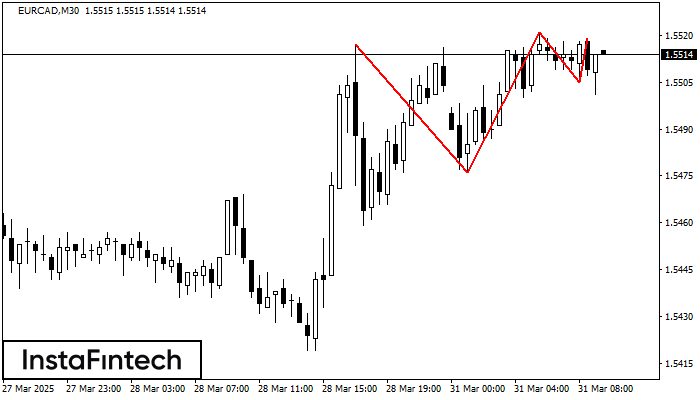
Triple Top
was formed on 31.03 at 08:30:26 (UTC+0)
signal strength 3 of 5

The Triple Top pattern has formed on the chart of the EURCAD M30. Features of the pattern: borders have an ascending angle; the lower line of the pattern has the coordinates 1.5476/1.5505 with the upper limit 1.5517/1.5519; the projection of the width is 41 points. The formation of the Triple Top figure most likely indicates a change in the trend from upward to downward. This means that in the event of a breakdown of the support level of 1.5476, the price is most likely to continue the downward movement.
- All
- All
- Bullish Rectangle
- Bullish Symmetrical Triangle
- Bullish Symmetrical Triangle
- Double Bottom
- Double Top
- Double Top
- Triple Top
- Triple Top
- Triple Top
- Triple Top
- All
- All
- Buy
- Sale
- All
- 1
- 2
- 3
- 4
- 5
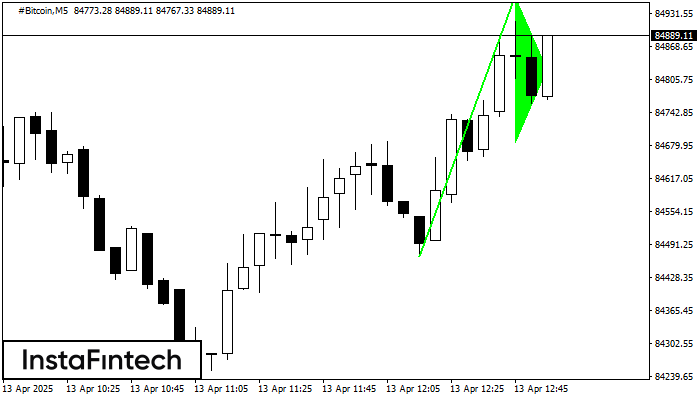
Býčia vlajka
was formed on 13.04 at 11:56:52 (UTC+0)
signal strength 1 of 5
Signál Býčia vlajka – obchodný nástroj #Bitcoin M5, formácia pokračujúceho trendu. Prognóza: nad maximom formácie 84963.00 môžete otvoriť nákupnú pozíciu s vyhliadkou, že ďalší pohyb ceny bude zodpovedať výške priemetu
Na grafoch s časovými rámcami M5 a M15 môže vzniknúť viac falošných miest vstupu na trh.
Open chart in a new window
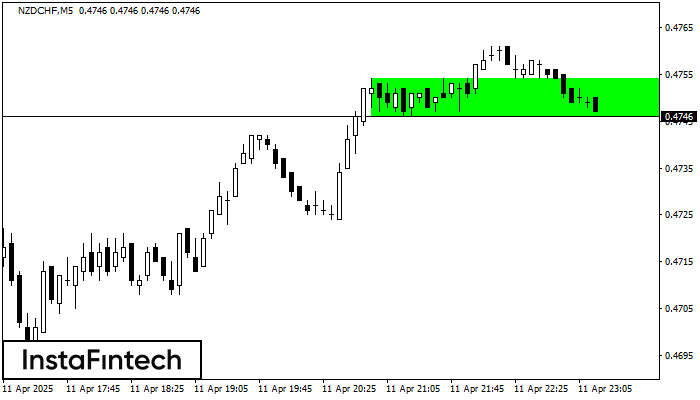
Býčí obdĺžnik
was formed on 11.04 at 22:20:31 (UTC+0)
signal strength 1 of 5
Na grafe nástroja NZDCHF s časovým rámcom M5 vznikla formácia Býčí obdĺžnik. Táto formácia naznačuje pokračovanie trendu. Jeho horná hranica je na úrovni 0.4754 a spodná je na 0.4746
Na grafoch s časovými rámcami M5 a M15 môže vzniknúť viac falošných miest vstupu na trh.
Open chart in a new window
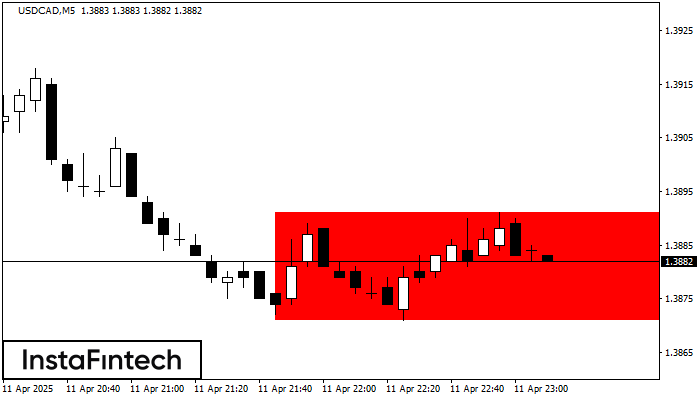
Medvedí obdĺžnik
was formed on 11.04 at 22:10:27 (UTC+0)
signal strength 1 of 5
Na grafe nástroja USDCAD s časovým rámcom M5 vznikla formácia Medvedí obdĺžnik, čo je formácia, ktorá signalizuje pokračovanie trendu. Spodná hranica formácie sa nachádza na úrovni 1.3891 – 1.3891
Na grafoch s časovými rámcami M5 a M15 môže vzniknúť viac falošných miest vstupu na trh.
Open chart in a new window


