


Aktuálne formácie

Formácie sú grafické modely, ktoré v grafe vytvára pohyb ceny. Jedným z postulátov technickej analýzy je, že história (pohyb ceny) sa opakuje. Znamená to, že pohyby ceny sú v rovnakých situáciách často podobné, čo umožňuje s vysokou pravdepodobnosťou predpovedať ďalší vývoj situácie.
Služba Aktuálne formácie od InstaForexu sa ľahko používa. Vďaka nej sa dozviete o aktuálnych zmenách na trhu a budete tak môcť včas zareagovať na signály trhu. Táto služba vám vždy prinesie informácie o najnovších a najdôležitejších formáciách každého páru v ľubovoľnom časovom rámci.
Triple Bottom
was formed on 07.04 at 02:30:15 (UTC+0)
signal strength 1 of 5
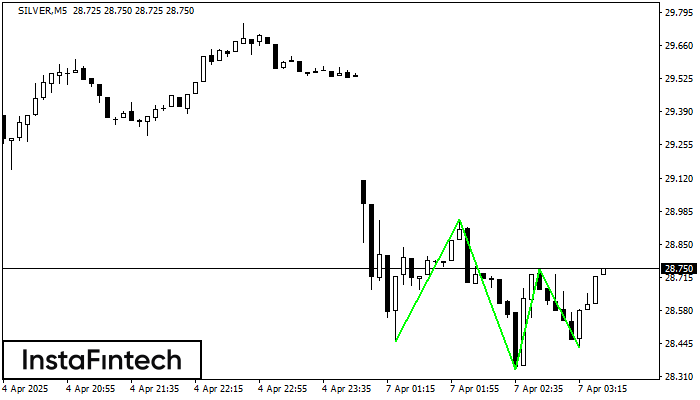
The Triple Bottom pattern has formed on the chart of SILVER M5. Features of the pattern: The lower line of the pattern has coordinates 28.95 with the upper limit 28.95/28.75, the projection of the width is 495 points. The formation of the Triple Bottom pattern most likely indicates a change in the trend from downward to upward. This means that in the event of a breakdown of the resistance level 28.45, the price is most likely to continue the upward movement.
The M5 and M15 time frames may have more false entry points.
- All
- All
- Bullish Rectangle
- Bullish Symmetrical Triangle
- Bullish Symmetrical Triangle
- Double Bottom
- Double Top
- Double Top
- Triple Top
- Triple Top
- Triple Top
- Triple Top
- All
- All
- Buy
- Sale
- All
- 1
- 2
- 3
- 4
- 5


