


¡Nuestro equipo cuenta con más de 7,000,000 operadores!
Cada día, trabajamos juntos para mejorar las operaciones. Obtenemos grandes resultados y seguimos adelante.
El reconocimiento de millones de operadores en todo el mundo es el mejor agradecimiento a nuestro trabajo! ¡Usted hizo su elección y haremos todo lo que esté a nuestro alcance para satisfacer sus expectativas!
¡Juntos somos un gran equipo!
InstaSpot. ¡Orgulloso de trabajar para usted!


¡Actor, 6 veces ganador del torneo UFC y un verdadero héroe!
El hombre que se hizo a sí mismo. El hombre que sigue nuestro camino.
El secreto detrás del éxito de Taktarov es el constante movimiento hacia el objetivo.
¡Revele todo los lados de su talento!
Descubra, intente, fracase, ¡pero nunca se rinda!
InstaSpot. ¡Su historia de éxito comienza aquí!
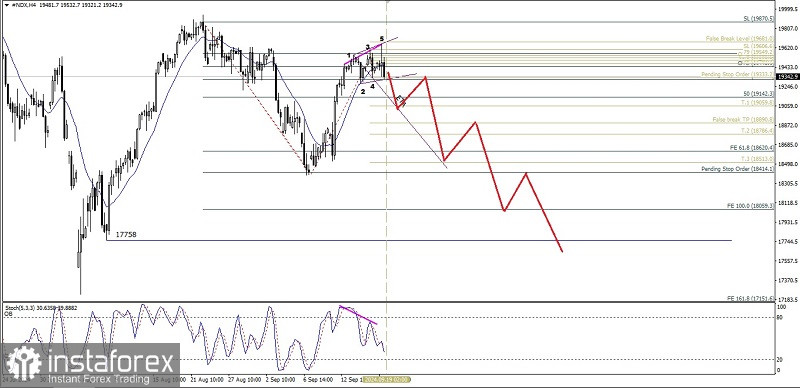
On the 4-hour chart, the Nasdaq 100 index appears to have a deviation between the price movement of the index and the Stochastic Oscillator indicator and the appearance of the Bearish Wolf Waves pattern so that in the near future #NDX has the potential to weaken down towards the ETA Line of the Wolf Waves where the level of 19342.9 will be tested in the near future if it turns out to be successfully penetrated downwards and as long as there is no significant strengthening that breaks above the level of 19870.5, #NDX will continue to weaken again to the level of 18620.4 and if the momentum and volatility support it, #NDX has the potential to go to the level of 17758.0.
(Disclaimer)
*El análisis de mercado publicado aquí tiene la finalidad de incrementar su conocimiento, más no darle instrucciones para realizar una operación.
¡Los informes analíticos de InstaSpot lo mantendrá bien informado de las tendencias del mercado! Al ser un cliente de InstaSpot, se le proporciona una gran cantidad de servicios gratuitos para una operación eficiente.


