


¡Nuestro equipo cuenta con más de 7,000,000 operadores!
Cada día, trabajamos juntos para mejorar las operaciones. Obtenemos grandes resultados y seguimos adelante.
El reconocimiento de millones de operadores en todo el mundo es el mejor agradecimiento a nuestro trabajo! ¡Usted hizo su elección y haremos todo lo que esté a nuestro alcance para satisfacer sus expectativas!
¡Juntos somos un gran equipo!
InstaSpot. ¡Orgulloso de trabajar para usted!


¡Actor, 6 veces ganador del torneo UFC y un verdadero héroe!
El hombre que se hizo a sí mismo. El hombre que sigue nuestro camino.
El secreto detrás del éxito de Taktarov es el constante movimiento hacia el objetivo.
¡Revele todo los lados de su talento!
Descubra, intente, fracase, ¡pero nunca se rinda!
InstaSpot. ¡Su historia de éxito comienza aquí!
Trend analysis (Fig. 1)
GBP/USD may continue its upward movement, rising from the level of 1.2720 (closing of yesterday's daily candle) and testing the historical resistance level of 1.2797 (blue dashed line). Upon reaching this, the pair may bounce back to the support line at 1.2779 (thick blue line).
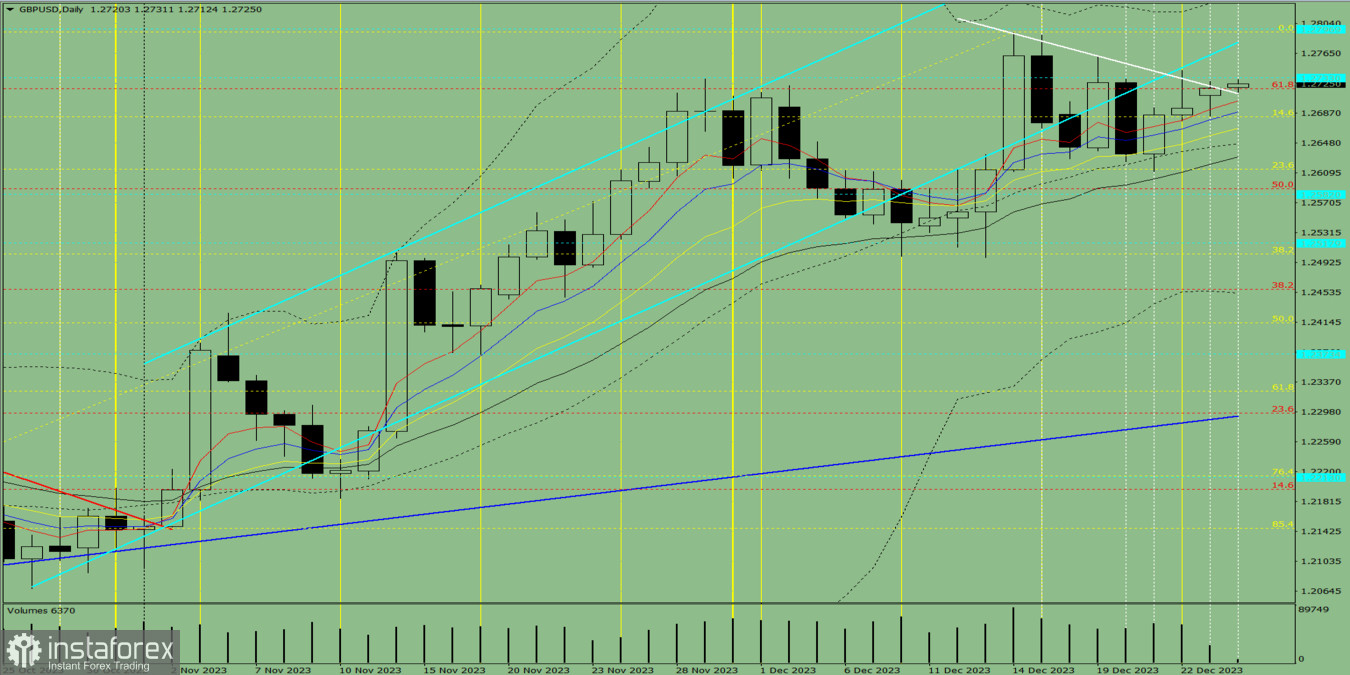
Fig. 1 (daily chart)
Comprehensive analysis:
Indicator analysis - uptrend
Fibonacci levels - uptrend
Volume - uptrend
Candlestick analysis - downtrend
Trend analysis - uptrend
Bollinger bands - uptrend
Weekly chart - uptrend
Conclusion: From the level of 1.2720 (closing of yesterday's daily candle), GBP/USD will climb upwards and test the historical resistance level of 1.2797 (blue dashed line). After this could be a rebound to the support line at 1.2779 (thick blue line).
Alternatively, there may be a rise from 1.2720 (closing of yesterday's daily candle) to the resistance line at 1.2779 (thick blue line), followed by a decline to the historical support level of 1.2733 (blue dashed line).
*El análisis de mercado publicado aquí tiene la finalidad de incrementar su conocimiento, más no darle instrucciones para realizar una operación.
¡Los informes analíticos de InstaSpot lo mantendrá bien informado de las tendencias del mercado! Al ser un cliente de InstaSpot, se le proporciona una gran cantidad de servicios gratuitos para una operación eficiente.


