


¡Nuestro equipo cuenta con más de 7,000,000 operadores!
Cada día, trabajamos juntos para mejorar las operaciones. Obtenemos grandes resultados y seguimos adelante.
El reconocimiento de millones de operadores en todo el mundo es el mejor agradecimiento a nuestro trabajo! ¡Usted hizo su elección y haremos todo lo que esté a nuestro alcance para satisfacer sus expectativas!
¡Juntos somos un gran equipo!
InstaSpot. ¡Orgulloso de trabajar para usted!


¡Actor, 6 veces ganador del torneo UFC y un verdadero héroe!
El hombre que se hizo a sí mismo. El hombre que sigue nuestro camino.
El secreto detrás del éxito de Taktarov es el constante movimiento hacia el objetivo.
¡Revele todo los lados de su talento!
Descubra, intente, fracase, ¡pero nunca se rinda!
InstaSpot. ¡Su historia de éxito comienza aquí!
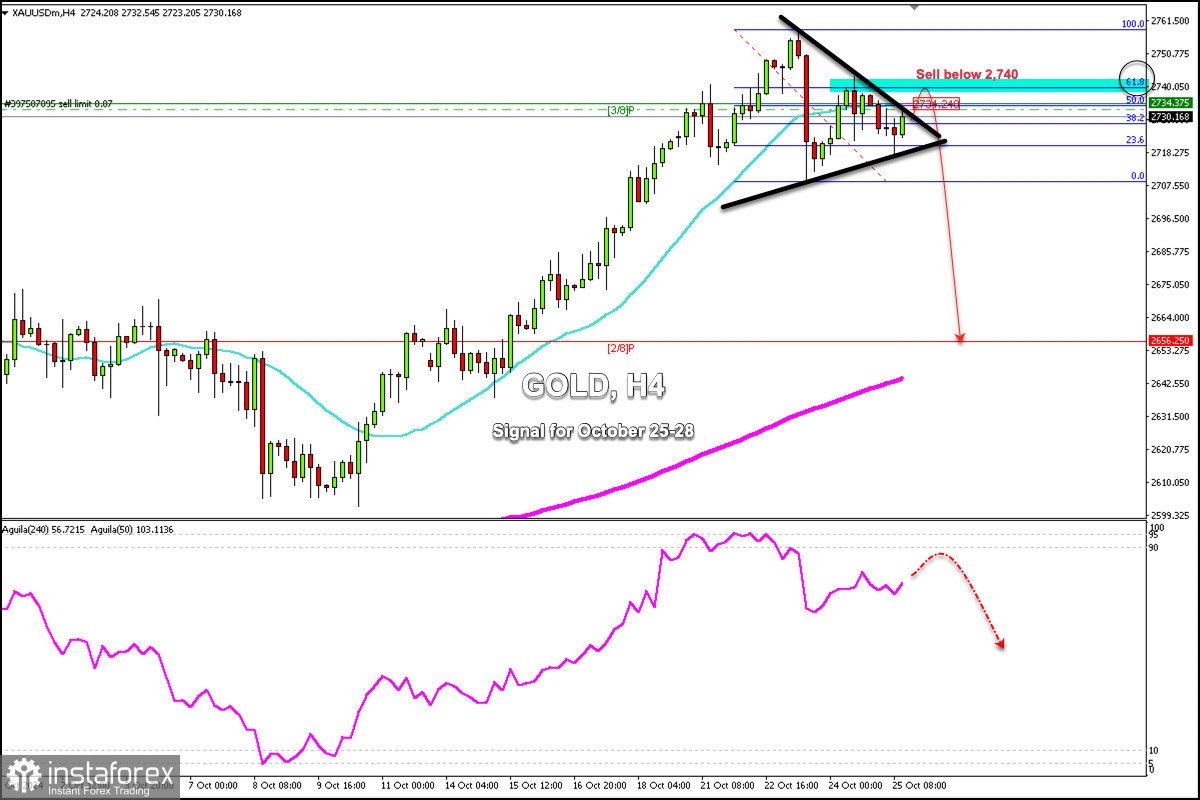
Early in the American session, gold is trading around 2,730 within the symmetrical triangle pattern forming since October 21, below 3/8 Murray, and below the 21 SMA.
On the H4 chart, we can see that after having made a strong technical correction from the high of 2,758 to the low of 2,708, gold is reaching the 61.8% zone, which means that the metal could resume its bearish cycle.
We could look for opportunities to sell gold if the price approaches 2,734 or 2,740 in the next few hours. Both levels act as strong resistance and suggest an opportunity to sell.
Technically, gold is overbought. So, as long as the instrument trades below the 61.8% Fibonacci at 2,740, any technical bounce will be seen as an opportunity to sell.
In case gold falls below the 32.8% Fibonacci level located around 2,728, we could expect a further bearish movement. If this scenario comes true, we can sell with targets at 2,696, and finally at 2/8 of Murray at 2,656.
*El análisis de mercado publicado aquí tiene la finalidad de incrementar su conocimiento, más no darle instrucciones para realizar una operación.
¡Los informes analíticos de InstaSpot lo mantendrá bien informado de las tendencias del mercado! Al ser un cliente de InstaSpot, se le proporciona una gran cantidad de servicios gratuitos para una operación eficiente.


