


¡Nuestro equipo cuenta con más de 7,000,000 operadores!
Cada día, trabajamos juntos para mejorar las operaciones. Obtenemos grandes resultados y seguimos adelante.
El reconocimiento de millones de operadores en todo el mundo es el mejor agradecimiento a nuestro trabajo! ¡Usted hizo su elección y haremos todo lo que esté a nuestro alcance para satisfacer sus expectativas!
¡Juntos somos un gran equipo!
InstaSpot. ¡Orgulloso de trabajar para usted!


¡Actor, 6 veces ganador del torneo UFC y un verdadero héroe!
El hombre que se hizo a sí mismo. El hombre que sigue nuestro camino.
El secreto detrás del éxito de Taktarov es el constante movimiento hacia el objetivo.
¡Revele todo los lados de su talento!
Descubra, intente, fracase, ¡pero nunca se rinda!
InstaSpot. ¡Su historia de éxito comienza aquí!
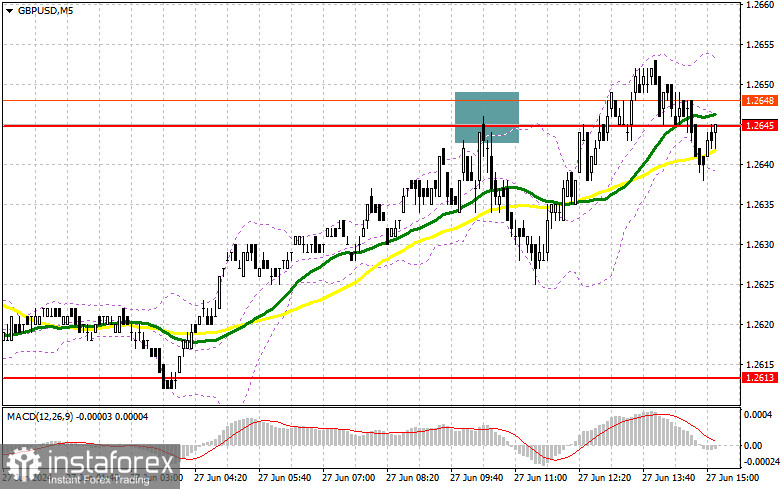
The pound is experiencing a slight boost, but it's hard to say how long it will last. Traders will likely react to the data on US GDP changes and initial jobless claims, and a significant positive deviation from forecasts could return pressure on the pair. Also, remember the report on changes in durable goods orders and the trade balance. In case of excellent statistics and further pair declines, I expect buyers to show up around the new support at 1.2613, formed from yesterday's results. Only a false breakout there will provide a point for entering long positions with the target of a new wave of growth to the 1.2660 level, below which the moving averages that favor sellers are located. A breakout and retest from top to bottom of this range will be suitable for buying, with the target of reaching the weekly high of 1.2700. The furthest target will be the area of 1.2732, where I plan to take profits. If GBP/USD falls and there is no activity from the bulls at 1.2613 in the second half of the day, the pound buyers will lose all initiative, returning a bearish character to the market. This will also lead to a decline and an update of the next support at 1.2583. Only a false breakout will be a suitable condition for opening long positions. I plan to buy GBP/USD immediately on a rebound from the 1.2550 minimum with the target of a 30-35 point intraday correction.
Sellers can re-enter the market at any moment, and strong data from the US will be enough for this. In case of a bullish reaction to the reports, only a false breakout around the 1.2660 resistance will be a suitable option for opening short positions with the target of a decline to the support area of 1.2613 – the weekly low. A breakout and retest from bottom to top will trigger stop-loss orders and open the way to 1.2583 – the new monthly low. The furthest target will be the 1.2550 area, where I will be taking profits. Testing this level will strengthen the bearish nature of the market. Buyers will regain initiative if GBP/USD rises and there is no activity at 1.2660 in the second half of the day. In this case, I will postpone sales until a false breakout at the 1.2700 level. If there is no downward movement, I will sell GBP/USD immediately on a rebound from 1.2732, but expecting a downward correction of the pair by 30-35 points intraday.
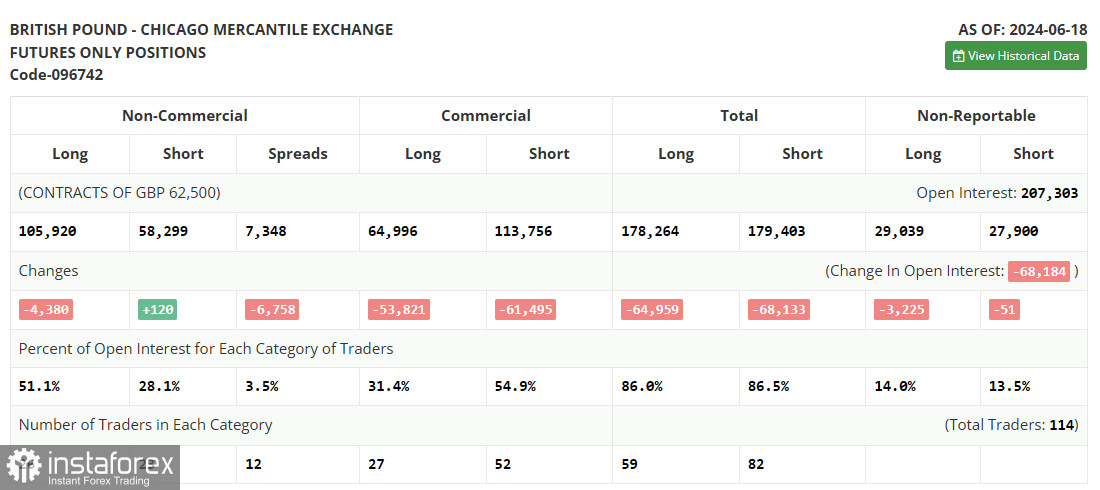
The COT report (Commitment of Traders) for June 18 showed an increase in short positions and a slight decrease in long positions. The outcomes of the Bank of England meeting, which announced that rates in the UK could be lowered as early as August this year, did not come as a revelation to traders but still influenced the balance of power, leading to a sharp reduction in long positions. The greater contrast with the policy and actions of the Federal Reserve, which recently left interest rates unchanged, signaling only one possible rate cut this year, maintains demand for the US dollar and plays in its favor. The latest COT report indicates that non-commercial long positions fell by 4,380 to 105,920, while non-commercial short positions increased by 120 to 58,299. As a result, the spread between long and short positions decreased by 6,785.
Indicator Signals:
Moving Averages
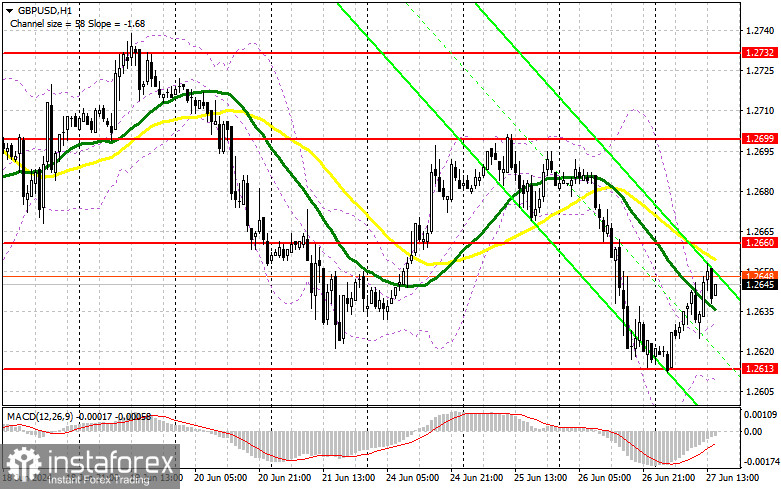
Trading is conducted below the 30 and 50-day moving averages, indicating a further decline in the pair.
Note: The author considers the period and prices of the moving averages on the hourly H1 chart, which differs from the general definition of the classic daily moving averages on the daily D1 chart.
Bollinger Bands
In case of a decline, the indicator's lower boundary, around 1.2613, will act as support.
Indicator Descriptions
• Moving Average (determines the current trend by smoothing volatility and noise). Period 50. Marked in yellow on the chart.
• Moving Average (determines the current trend by smoothing volatility and noise). Period 30. Marked in green on the chart.
• MACD Indicator (Moving Average Convergence/Divergence). Fast EMA period 12. Slow EMA period 26. SMA period 9
• Bollinger Bands. Period 20
• Non-commercial traders - speculators such as individual traders, hedge funds, and large institutions using the futures market for speculative purposes and meeting certain requirements.
• Long non-commercial positions represent the total long open position of non-commercial traders.
• Short non-commercial positions represent the total short open position of non-commercial traders.
• The total non-commercial net position is the difference between non-commercial traders' short and long positions.
*El análisis de mercado publicado aquí tiene la finalidad de incrementar su conocimiento, más no darle instrucciones para realizar una operación.
¡Los informes analíticos de InstaSpot lo mantendrá bien informado de las tendencias del mercado! Al ser un cliente de InstaSpot, se le proporciona una gran cantidad de servicios gratuitos para una operación eficiente.


