


¡Nuestro equipo cuenta con más de 7,000,000 operadores!
Cada día, trabajamos juntos para mejorar las operaciones. Obtenemos grandes resultados y seguimos adelante.
El reconocimiento de millones de operadores en todo el mundo es el mejor agradecimiento a nuestro trabajo! ¡Usted hizo su elección y haremos todo lo que esté a nuestro alcance para satisfacer sus expectativas!
¡Juntos somos un gran equipo!
InstaSpot. ¡Orgulloso de trabajar para usted!


¡Actor, 6 veces ganador del torneo UFC y un verdadero héroe!
El hombre que se hizo a sí mismo. El hombre que sigue nuestro camino.
El secreto detrás del éxito de Taktarov es el constante movimiento hacia el objetivo.
¡Revele todo los lados de su talento!
Descubra, intente, fracase, ¡pero nunca se rinda!
InstaSpot. ¡Su historia de éxito comienza aquí!
USD/JPY
Higher Time Frames
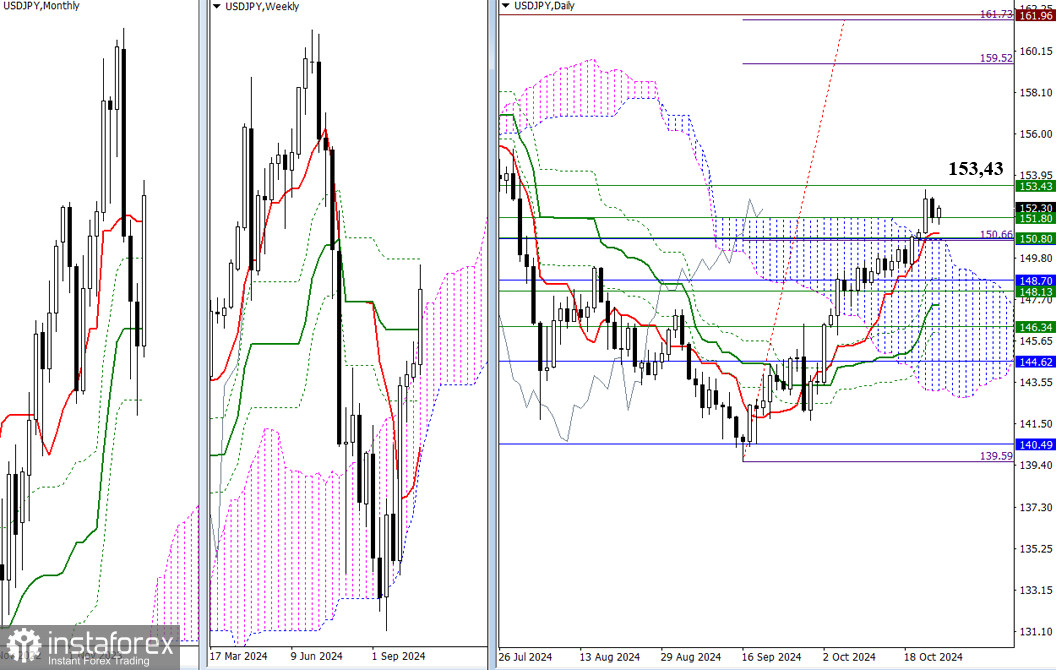
Last week, the pair moved out of the daily Ichimoku cloud and settled in the bullish zone, setting an upward target to break through the daily Ichimoku cloud at 159.52 – 161.73. The final level of the weekly dead cross (153.42) stands in the way of this daily target. Breaking through the weekly cross will allow the bulls to focus on reaching the daily target, which would lead to testing the monthly peak at 161.96. If the price successfully updates and consolidates above this peak, bulls will exit the monthly corrective zone, potentially resuming the global uptrend and exploring new upward prospects. If the bulls fail at their current position, the opponents may return the pair to the weekly Ichimoku cloud at 151.80, then descend into the daily cloud at 150.70. In such a case, increased bearish activity and the bulls' conceding ground could cancel or adjust the current daily breakout target. To further develop a bearish scenario on this section of the chart, sellers will need to break through the daily Ichimoku cross at 147.03 – 146.06 and overcome weekly (148.13 – 146.34) and monthly (148.70 – 144.62) support levels.
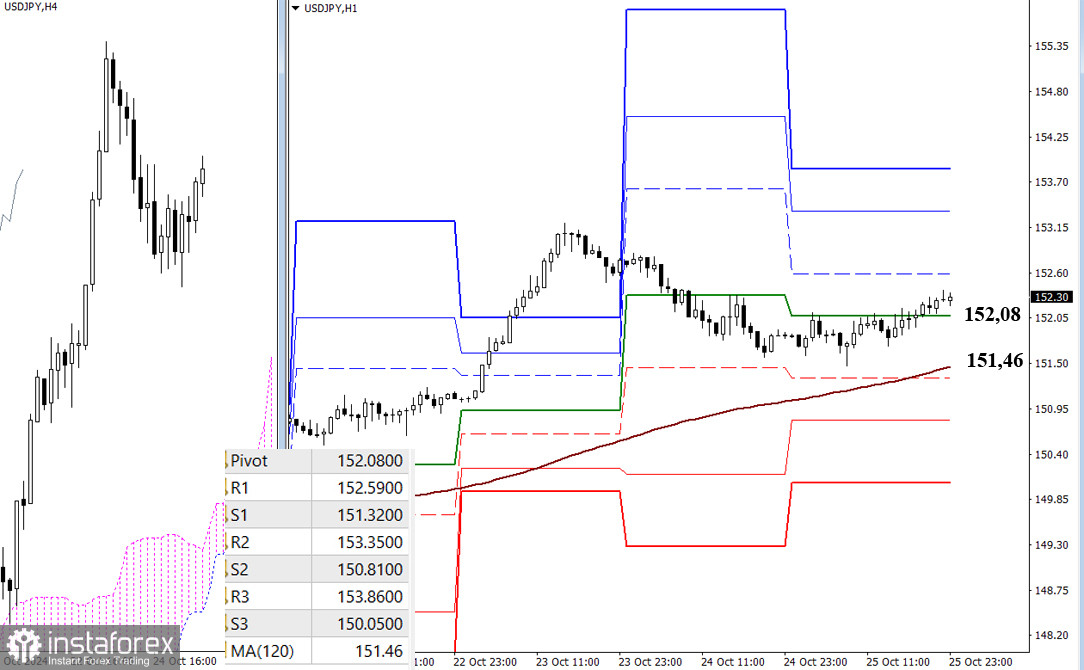
H4 – H1
The advantage remains with the bulls on the lower time frames, even though the pair has been in a corrective phase for some time. The weekly long-term trend, currently located at 151.46, serves as the primary reference for correction. This level is critical for maintaining the current balance of power. Trading above this trend supports a bullish advantage, so further bullish momentum is likely. The intraday targets for bulls include resistance levels of the classic Pivot Points. Trading below this trend favors the bears in advancing a downward correction. For intraday bearish targets, traders can use support levels of the classic Pivot Points. The values of the classical Pivot levels will be available at the beginning of the new trading week upon market opening.
Technical Analysis Components:
*El análisis de mercado publicado aquí tiene la finalidad de incrementar su conocimiento, más no darle instrucciones para realizar una operación.
¡Los informes analíticos de InstaSpot lo mantendrá bien informado de las tendencias del mercado! Al ser un cliente de InstaSpot, se le proporciona una gran cantidad de servicios gratuitos para una operación eficiente.


