


¡Nuestro equipo cuenta con más de 7,000,000 operadores!
Cada día, trabajamos juntos para mejorar las operaciones. Obtenemos grandes resultados y seguimos adelante.
El reconocimiento de millones de operadores en todo el mundo es el mejor agradecimiento a nuestro trabajo! ¡Usted hizo su elección y haremos todo lo que esté a nuestro alcance para satisfacer sus expectativas!
¡Juntos somos un gran equipo!
InstaSpot. ¡Orgulloso de trabajar para usted!


¡Actor, 6 veces ganador del torneo UFC y un verdadero héroe!
El hombre que se hizo a sí mismo. El hombre que sigue nuestro camino.
El secreto detrás del éxito de Taktarov es el constante movimiento hacia el objetivo.
¡Revele todo los lados de su talento!
Descubra, intente, fracase, ¡pero nunca se rinda!
InstaSpot. ¡Su historia de éxito comienza aquí!
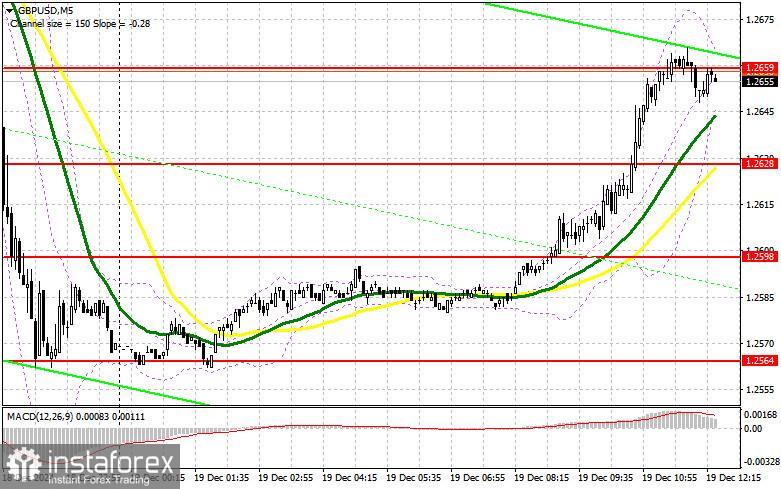
In my morning forecast, I highlighted the level of 1.2598 and planned to make trading decisions based on it. Let's look at the 5-minute chart and analyze what happened. The pound's rise led to a breakout of 1.2598, but there was no retest, leaving me without trades during the first half of the day. The technical picture has been revised for the second half of the session.
The significant rise in the pound before the Bank of England's rate decision surprised many. I discussed the possible actions of the regulator in detail in my morning forecast, so there is no need to repeat them. Additionally, attention should be paid to US data. Reports on initial jobless claims, Q3 GDP changes, and existing home sales volumes are expected. Strong US data and a dovish position from the Bank of England could put pressure back on the pound.
In this scenario, action is expected around 1.2628. A false breakout at this level would provide a good entry point for buying, aiming for a recovery of GBP/USD toward the 1.2659 resistance area. A breakout and retest of this range from above could lead to a new entry point for long positions with prospects for reaching 1.2687, where buyers are likely to face challenges. The ultimate target will be the 1.2718 area, where I plan to take profit.
If GBP/USD declines and bulls fail to show activity near 1.2628, buyers will lose initiative. In this case, only a false breakout near the next support at 1.2598 would provide a suitable condition for opening long positions. I plan to buy GBP/USD immediately on a rebound from 1.2564, targeting an intraday correction of 30–35 points.
Pound sellers actively defend 1.2659, but they have yet to achieve a larger drop in line with yesterday's trend. Strong US GDP data and another false breakout at 1.2659 would provide a market entry point for selling, targeting support at 1.2628. A breakout and retest of this range from below would trigger stop orders, paving the way for 1.2598, which would significantly impact bullish positions. The ultimate target will be the 1.2564 level, where I will take profit.
If demand for the pound returns during the second half of the day following weak US data, and sellers fail to show activity near 1.2659, where moving averages also favor the bears, buyers will have a good chance for a new wave of growth. Bears will have no choice but to retreat to the 1.2687 resistance area. I plan to sell there only after a false breakout. If there is no downward movement even at this level, I will look for short positions near 1.2718, targeting a correction of 30–35 points.
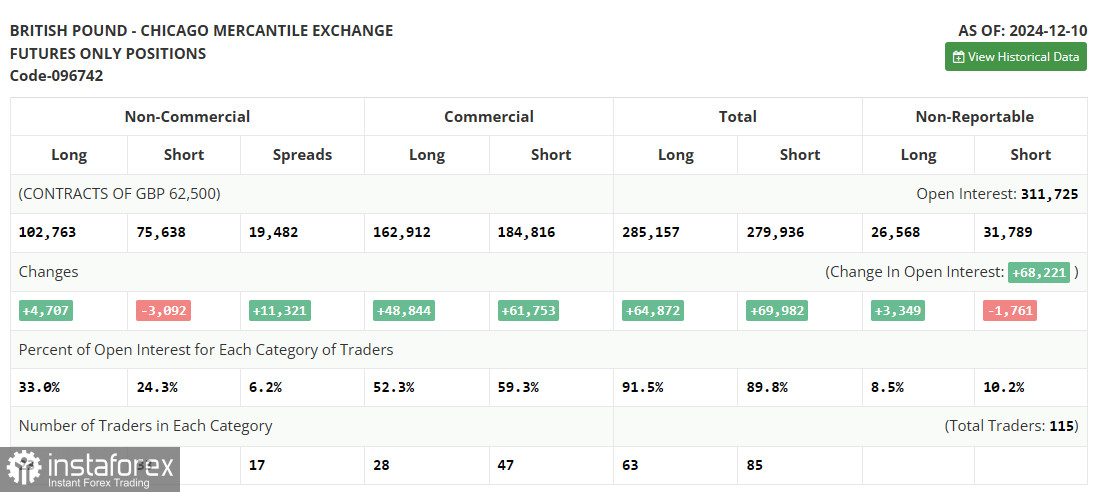
The COT (Commitment of Traders) report for December 10 showed a reduction in short positions and an increase in long positions. Overall, the market balance remained unchanged, as many traders adopted a wait-and-see approach ahead of the Bank of England's final meeting of the year. The central bank's decision on interest rates is highly uncertain. Recent GDP and inflation data have put the regulator in a very challenging position, forcing traders to act cautiously. The latest COT report showed that non-commercial long positions increased by 4,707 to 102,763, while short positions decreased by 3,092 to 75,638. As a result, the gap between long and short positions widened by 11,321.
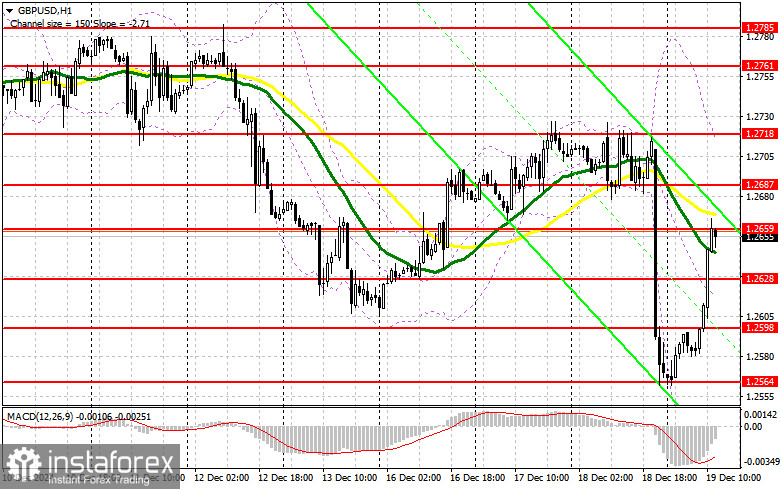
Moving Averages:The pair is trading below the 30- and 50-day moving averages, indicating further downward potential.
Note: The author uses H1 chart periods and prices for moving averages, which differ from the classical definitions on the D1 daily chart.
Bollinger Bands:In case of a decline, the lower boundary of the indicator near 1.2560 will act as support.
*El análisis de mercado publicado aquí tiene la finalidad de incrementar su conocimiento, más no darle instrucciones para realizar una operación.
¡Los informes analíticos de InstaSpot lo mantendrá bien informado de las tendencias del mercado! Al ser un cliente de InstaSpot, se le proporciona una gran cantidad de servicios gratuitos para una operación eficiente.


