- El informe publicado hoy sobre el crecimiento de la inflación en la capital de Japón resultó estar en la "zona verde". La publicación permitió a los vendedores del par usd/jpy
Autor: Irina Manzenko
13:25 2025-03-28 UTC+2
2
Mercados bursátilesMercado bursátil al 28 de marzo: los índices SP500 y NASDAQ en una situación complicada
Al cierre de la sesión regular de ayer, los índices bursátiles estadounidenses terminaron en negativo. El S&P 500 se desplomó un 0,33% y el Nasdaq 100 cayó un 0,53%Autor: Jakub Novak
09:10 2025-03-28 UTC+2
3
El Bitcoin y Ethereum siguen enfrentando dificultades. Otro intento fallido de que el Bitcoin se mantuviera por encima del nivel de 88 000 llevó a su venta durante la sesiónAutor: Miroslaw Bawulski
08:52 2025-03-28 UTC+2
1
- A pesar de la implementación exitosa de la actualización de prueba Pectra en la nueva red de pruebas Hoodi —lo que representa el último paso antes de su implementación
Autor: Jakub Novak
08:52 2025-03-28 UTC+2
2
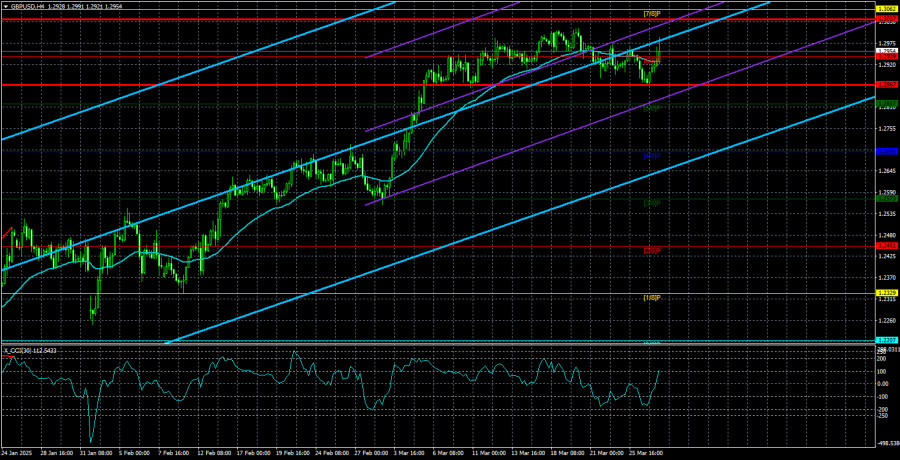
Análisis FundamentalAnálisis del par GBP/USD. El 28 de marzo. La libra no tuvo tiempo de caer, pero volvió a subir.
El par de divisas GBP/USD volvió a cotizarse al alza el jueves, aunque hace unos días comenzó una especie de corrección bajista. El mercado incluso reaccionó a un informe débilAutor: Paolo Greco
08:24 2025-03-28 UTC+2
3
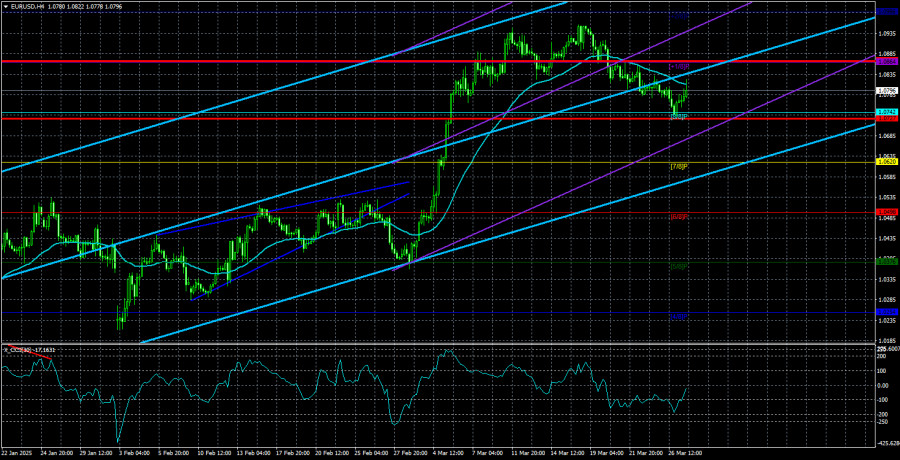
Análisis FundamentalAnálisis del par EUR/USD. 28 de marzo. A Donald Trump le gusta hacer sorpresas.
El par de divisas EUR/USD mantuvo una inclinación bajista durante el jueves, pero se negoció al alza durante el día. La volatilidad volvió a ser baja, lo que indicaAutor: Paolo Greco
08:24 2025-03-28 UTC+2
2
- Análisis Fundamental
USD/JPY. El yen se devalua a la espera del informe sobre el crecimiento del TCPI
El par usd/jpy mantiene el potencial de un mayor crecimiento. El informe sobre el crecimiento del TCPI, que se publicará el viernes, o bien reforzará la tendencia alcista, o provocaráAutor: Irina Manzenko
13:13 2025-03-27 UTC+2
18
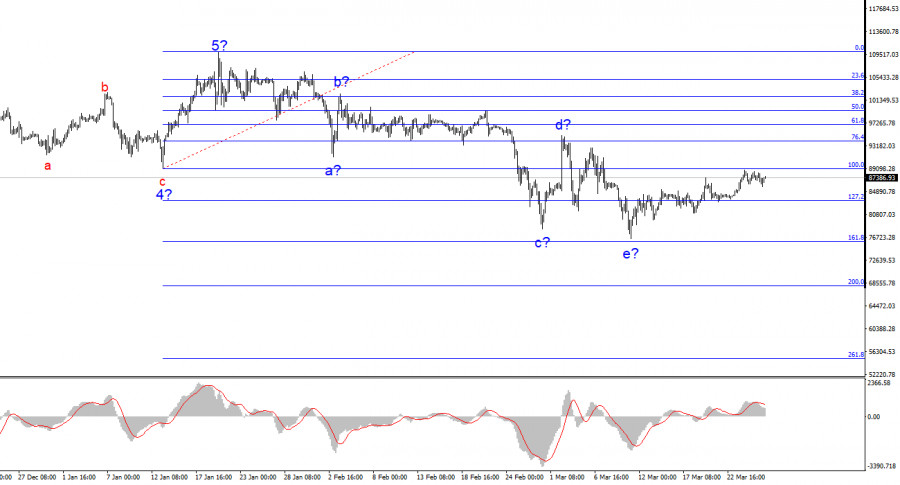
CriptomonedasAnálisis del par BTC/USD. El 27 de marzo. El Bitcoin no tiene potencial de crecimiento
La estructura de ondas del gráfico de 4 horas para el instrumento BTC/USD es completamente comprensible. Después de completar un tramo ascendente de la tendencia, compuesto por cinco ondas completasAutor: Chin Zhao
09:25 2025-03-27 UTC+2
25
Mercados bursátilesMercado bursátil el 27 de marzo: los índices SP500 y NASDAQ se desplomaron tras los nuevos aranceles de Trump
Al cierre de la sesión regular de ayer, los índices bursátiles estadounidenses terminaron en rojo. El S&P 500 se desplomó un 1,12% y el Nasdaq 100 cayó un 2,24%Autor: Jakub Novak
09:14 2025-03-27 UTC+2
23


