


¡Nuestro equipo cuenta con más de 7,000,000 operadores!
Cada día, trabajamos juntos para mejorar las operaciones. Obtenemos grandes resultados y seguimos adelante.
El reconocimiento de millones de operadores en todo el mundo es el mejor agradecimiento a nuestro trabajo! ¡Usted hizo su elección y haremos todo lo que esté a nuestro alcance para satisfacer sus expectativas!
¡Juntos somos un gran equipo!
InstaSpot. ¡Orgulloso de trabajar para usted!


¡Actor, 6 veces ganador del torneo UFC y un verdadero héroe!
El hombre que se hizo a sí mismo. El hombre que sigue nuestro camino.
El secreto detrás del éxito de Taktarov es el constante movimiento hacia el objetivo.
¡Revele todo los lados de su talento!
Descubra, intente, fracase, ¡pero nunca se rinda!
InstaSpot. ¡Su historia de éxito comienza aquí!
In my morning forecast, I focused on the 1.0404 level and planned to base my trading decisions on it. Let's analyze the 5-minute chart to see what happened. A decline and false breakout at this level provided a long entry opportunity, resulting in a rise of over 40 points. The technical outlook for the second half of the day has been revised.
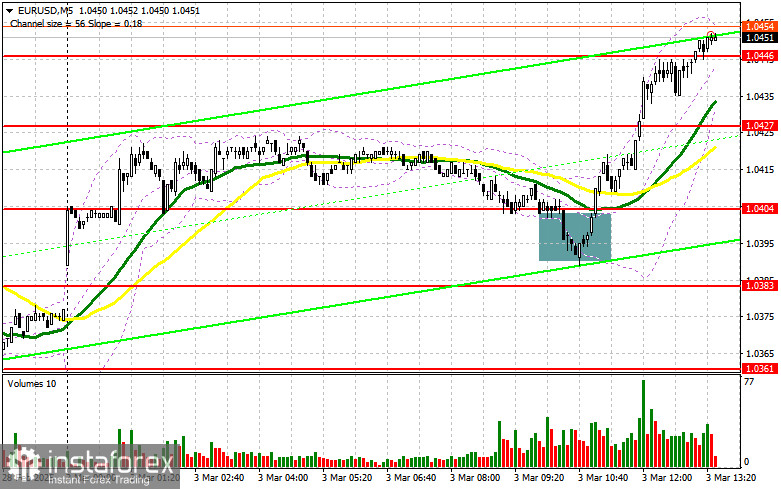
To Open Long Positions on EUR/USD:
Manufacturing activity in the eurozone continues to recover, and February's data showed that the pace of contraction has slowed compared to previous months. This supported the euro, triggering another wave of growth against the U.S. dollar.
In the second half of the day, attention will be on the ISM Manufacturing Index in the U.S. for February and construction spending data. Strong figures may limit EUR/USD's upward potential. Given the bullish market, I plan to buy on dips.
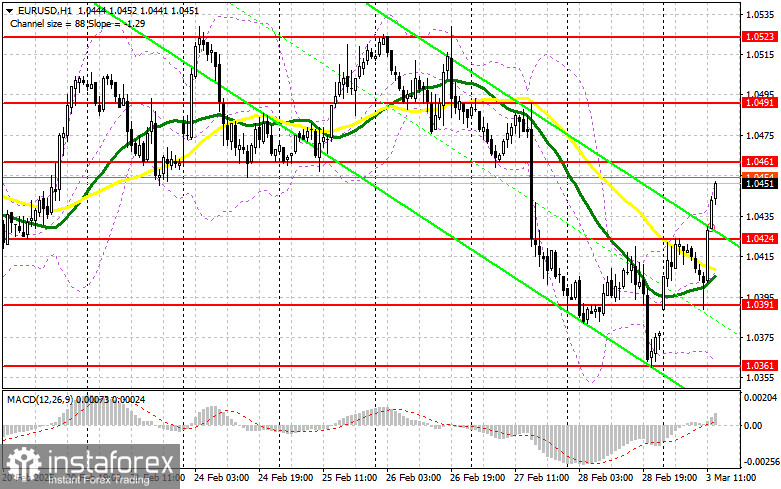
A false breakout at the 1.0424 support level would provide an ideal buy signal, targeting 1.0461, which formed as resistance last week. A breakout and retest of this range from above would confirm a long entry, pushing the pair toward 1.0491. The final target is the 1.0523 high, where I plan to lock in profits.
If EUR/USD declines and there is no buying activity at 1.0424, euro demand will drop further, allowing sellers to push the price down to 1.0391 – a new support level. I will consider long positions only after a false breakout at this level. I plan to buy on an immediate rebound from 1.0361, targeting an intraday correction of 30-35 points.
To Open Short Positions on EUR/USD:
Sellers have been relatively inactive, focusing on defending resistance at 1.0461, which is likely to be tested soon. A false breakout at this level will signal a short entry, targeting support at 1.0424.
A break below 1.0424 (which is only likely with strong U.S. manufacturing data) and retest from below would confirm another selling opportunity, with 1.0391 as the next target. The final bearish target is 1.0361, where I plan to take profits.
If EUR/USD rises further in the second half of the day and sellers fail to act at 1.0461, buyers may push for stronger gains. In this case, I will postpone short positions until a test of 1.0491. I will sell only after a failed consolidation above this level. If there is no downward movement there either, I will look for short entries at 1.0523, expecting a 30-35 point correction.
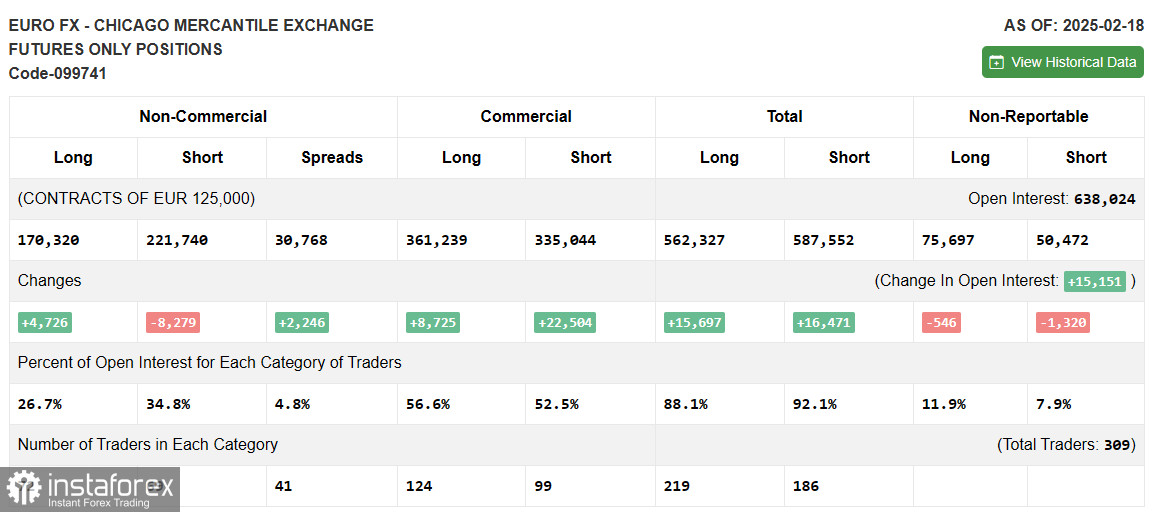
COT (Commitment of Traders) Report Analysis
The COT report from February 18 showed an increase in long positions and a sharp reduction in shorts. Interest in buying euros has risen, driven by talks between the U.S. and Russia regarding the Ukraine conflict. The potential for de-escalation has boosted demand for risk assets, helping the euro.
However, sellers still maintain an advantage, so caution is needed when buying at highs. The COT report revealed that non-commercial long positions increased by 4,726, reaching 170,320, while short positions dropped by 8,279, totaling 221,740. As a result, the net short position has declined by 2,246.
Indicator Signals
The pair is trading above the 30 and 50-period moving averages, signaling a return of buyers to the market.
Note: The moving averages referenced are based on the H1 chart, differing from traditional daily moving averages (D1).
If the pair declines, the lower Bollinger Band at 1.0361 will act as support.
Indicator Descriptions:
*El análisis de mercado publicado aquí tiene la finalidad de incrementar su conocimiento, más no darle instrucciones para realizar una operación.
¡Los informes analíticos de InstaSpot lo mantendrá bien informado de las tendencias del mercado! Al ser un cliente de InstaSpot, se le proporciona una gran cantidad de servicios gratuitos para una operación eficiente.
Notificaciones
por correo electrónico y mensaje de texto

Your IP address shows that you are currently located in the USA. If you are a resident of the United States, you are prohibited from using the services of InstaFintech Group including online trading, online transfers, deposit/withdrawal of funds, etc.
If you think you are seeing this message by mistake and your location is not the US, kindly proceed to the website. Otherwise, you must leave the website in order to comply with government restrictions.
Why does your IP address show your location as the USA?
Please confirm whether you are a US resident or not by clicking the relevant button below. If you choose the wrong option, being a US resident, you will not be able to open an account with InstaSpot anyway.
We are sorry for any inconvenience caused by this message.


