Patrones actuales

Los patrones son modelos gráficos que se forman en el gráfico mediante el precio. Según uno de los postulados del análisis técnico, la historia (movimiento del precio) se repite. Esto quiere decir que los movimientos del precio a menudo son similares en las mismas situaciones que hacen posible pronosticar el futuro desarrollo de la situación con una alta probabilidad.
Los patrones relevantes de InstaSpot son un servicio fácil de utilizar que permiten que conozca los últimos cambios en el mercado y reaccione a las pistas del mercado a tiempo. En nuestro servicio, siempre encontrará los últimos y más importantes patrones en cualquier par y en cualquier marco de tiempo.
Double Top
was formed on 28.03 at 15:30:06 (UTC+0)
signal strength 3 of 5
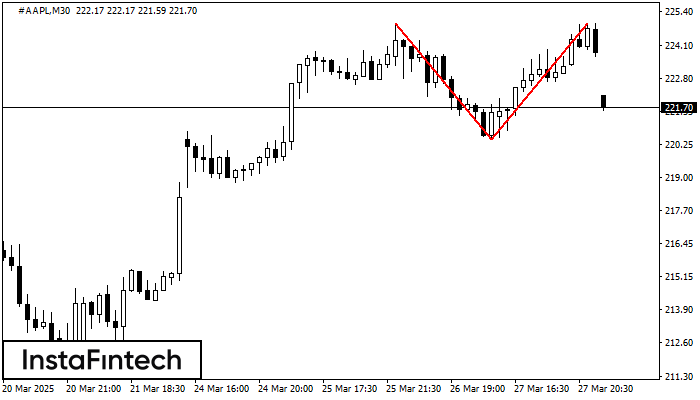
The Double Top pattern has been formed on #AAPL M30. It signals that the trend has been changed from upwards to downwards. Probably, if the base of the pattern 220.45 is broken, the downward movement will continue.
- All
- All
- Bullish Rectangle
- Bullish Symmetrical Triangle
- Bullish Symmetrical Triangle
- Double Bottom
- Double Top
- Double Top
- Triple Top
- Triple Top
- Triple Top
- Triple Top
- All
- All
- Buy
- Sale
- All
- 1
- 2
- 3
- 4
- 5
Bullisches Rechteck
was formed on 21.04 at 06:10:19 (UTC+0)
signal strength 1 of 5

Auf dem Chart M5 bildete #Bitcoin das «Bullisches Rechteck» Muster. Dies ist das Muster einer Trendfortsetzung. Die untere Grenze des Musters liegt bei 87098.24; die obere bei 87617.56. Bei einem
Die М5 und М15 Timeframes können mehrere falsche Einstiegspunkte haben.
Open chart in a new window
Doppel-Boden
was formed on 21.04 at 06:05:07 (UTC+0)
signal strength 1 of 5

Auf dem Chart M5 bildete USDJPY das «Doppel-Boden» Muster. Diese Formation signalisiert eine Trendwende von unten nach oben. Signal: eine Kaufposition sollte nach dem Durchbruch der oberen Grenze des Musters
Die М5 und М15 Timeframes können mehrere falsche Einstiegspunkte haben.
Open chart in a new window
Doppel-Top
was formed on 21.04 at 05:59:59 (UTC+0)
signal strength 1 of 5
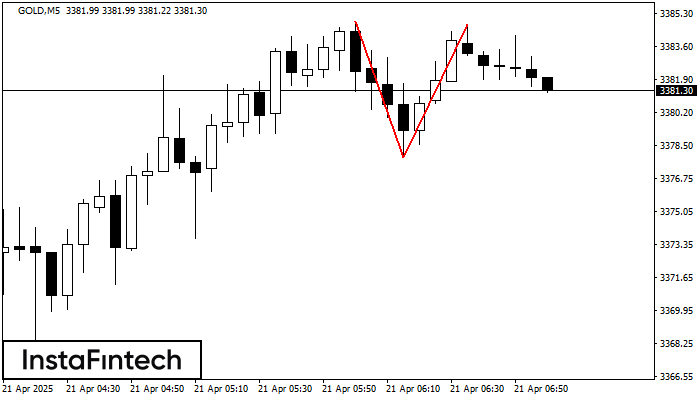
Auf dem Chart M5 bildete GOLD das «Doppel-Top» Muster. Beschreibung: die obere Grenze 3384.89; die untere Grenze3377.85; die Breite des Musters beträgt 687 Punkte. Sell-Position sind besser unter der unteren
Die М5 und М15 Timeframes können mehrere falsche Einstiegspunkte haben.
Open chart in a new window