Patrones actuales

Los patrones son modelos gráficos que se forman en el gráfico mediante el precio. Según uno de los postulados del análisis técnico, la historia (movimiento del precio) se repite. Esto quiere decir que los movimientos del precio a menudo son similares en las mismas situaciones que hacen posible pronosticar el futuro desarrollo de la situación con una alta probabilidad.
Los patrones relevantes de InstaSpot son un servicio fácil de utilizar que permiten que conozca los últimos cambios en el mercado y reaccione a las pistas del mercado a tiempo. En nuestro servicio, siempre encontrará los últimos y más importantes patrones en cualquier par y en cualquier marco de tiempo.
Bullish Rectangle
was formed on 02.04 at 02:16:17 (UTC+0)
signal strength 1 of 5
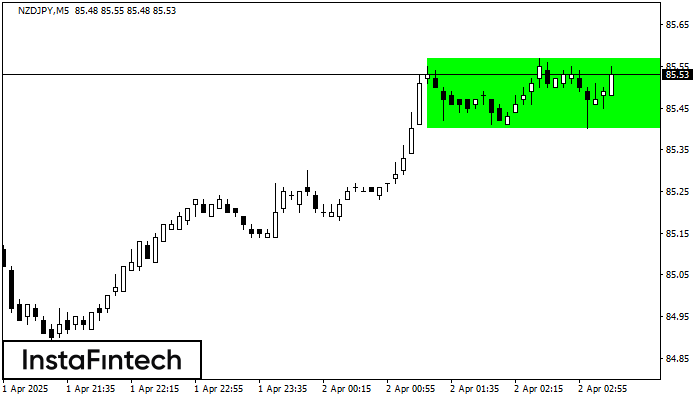
According to the chart of M5, NZDJPY formed the Bullish Rectangle which is a pattern of a trend continuation. The pattern is contained within the following borders: the lower border 85.40 – 85.40 and upper border 85.57 – 85.57. In case the upper border is broken, the instrument is likely to follow the upward trend.
The M5 and M15 time frames may have more false entry points.
- All
- All
- Bullish Rectangle
- Bullish Symmetrical Triangle
- Bullish Symmetrical Triangle
- Double Bottom
- Double Top
- Double Top
- Triple Top
- Triple Top
- Triple Top
- Triple Top
- All
- All
- Buy
- Sale
- All
- 1
- 2
- 3
- 4
- 5
Doble Piso
was formed on 16.04 at 19:30:25 (UTC+0)
signal strength 1 of 5
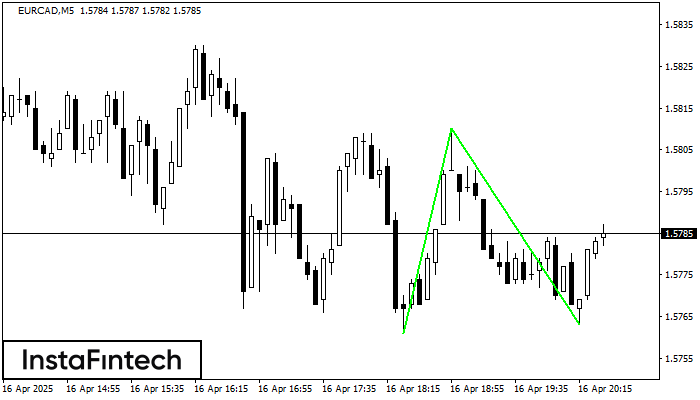
El patrón Doble Piso ha sido formado en EURCAD M5; el límite superior es 1.5810; el límite inferior es 1.5763. El ancho del patrón es 49 puntos. En caso
Los marcos de tiempo M5 y M15 pueden tener más puntos de entrada falsos.
Open chart in a new window
Doble Piso
was formed on 16.04 at 19:30:16 (UTC+0)
signal strength 2 of 5

El patrón Doble Piso ha sido formado en EURCAD M15. Características: el nivel de soporte 1.5761; el nivel de resistencia 1.5810; el ancho del patrón 49 puntos. Si el nivel
Los marcos de tiempo M5 y M15 pueden tener más puntos de entrada falsos.
Open chart in a new window
Doble Techo
was formed on 16.04 at 19:30:13 (UTC+0)
signal strength 3 of 5
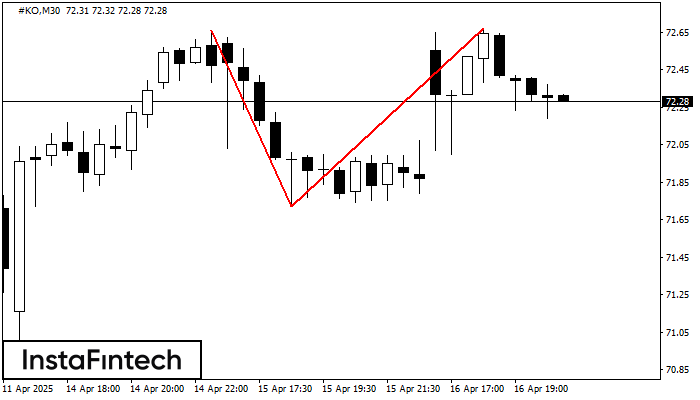
El patrón Doble Techo ha sido formado en #KO M30. Esto señala que la tendencia ha sido cambiada de alcista a bajista. Probablemente, si la base del patrón 71.72
Open chart in a new window