empty
th
สนับสนุน
เปิดบัญชีเทรดทันที
แพลตฟอร์มการเทรด
ฝาก/ถอน

Bearish Symmetrical Triangle
was formed on 21.03 at 10:30:41 (UTC+0)
signal strength 3 of 5

Bearish Symmetrical Triangle AUDUSD M30

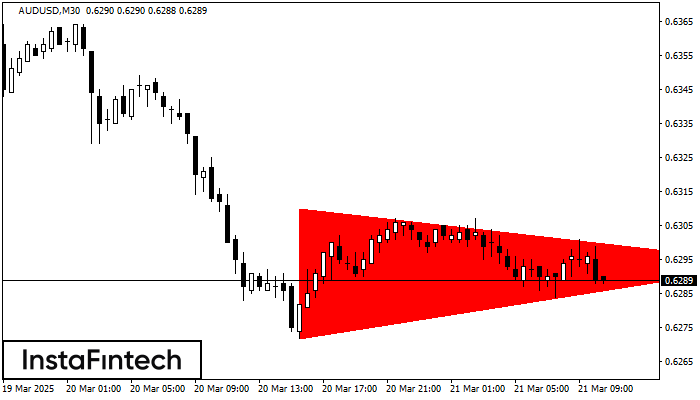
According to the chart of M30, AUDUSD formed the Bearish Symmetrical Triangle pattern. Description: The lower border is 0.6272/0.6294 and upper border is 0.6310/0.6294. The pattern width is measured on the chart at -38 pips. The formation of the Bearish Symmetrical Triangle pattern evidently signals a continuation of the downward trend. In other words, if the scenario comes true and AUDUSD breaches the lower border, the price could continue its move toward 0.6264.

Figure
  • All
Instrument
  • All
  • Bullish Rectangle
  • Bullish Symmetrical Triangle
  • Bullish Symmetrical Triangle
  • Double Bottom
  • Double Top
  • Double Top
  • Triple Top
  • Triple Top
  • Triple Top
  • Triple Top
Timeframe
  • All
Trend
  • All
  • Buy
  • Sale
Signal Strength
  • All
  • 1
  • 2
  • 3
  • 4
  • 5

รูปแบบกราฟสี่เหลี่ยมผืนผ้าขาขึ้น (Bullish Rectangle)
was formed on 21.04 at 06:10:19 (UTC+0)
signal strength 1 of 5

รูปแบบกราฟสี่เหลี่ยมผืนผ้าขาขึ้น (Bullish Rectangle) #Bitcoin M5

อ้างอิงจากชาร์ตของ M5, #Bitcoin ที่ได้สร้างรูปแบบ รูปแบบกราฟสี่เหลี่ยมผืนผ้าขาขึ้น (Bullish Rectangle) ออกมา ซึ่งเป็นรูปแบบของความต่อเนื่องในแนวโน้ม รูปแบบนี้จะอยู่ในขอบเขตตามนี้: ขอบเขตด้านล่าง 87098.24 – 87098.24

ขอบเตระยะเวลาใน M5 และ M15 อาจจะมีตำแหน่งการเข้าใช้งานที่ผิดพลาดมากยิ่งขึ้น

Open chart in a new window

รูปแบบกราฟจุดสองยอดขาลง (Double Bottom)
was formed on 21.04 at 06:05:07 (UTC+0)
signal strength 1 of 5

รูปแบบกราฟจุดสองยอดขาลง (Double Bottom) USDJPY M5

รูปแบบ รูปแบบกราฟจุดสองยอดขาลง (Double Bottom) ถูกสร้างขึ้นมาใน USDJPY M5 การก่อตัวเช่นนี้แสดงถึงการย้อนตัวของแนวโน้มจากด้านล่าง ขึ้นมายังด้านบน สัญญาณแสดงให้เห็นถึง การเทรดแบบการซื้อที่ควรเปิด หลังจากที่มีการเคลื่อนตัวทะลุผ่านขอบเขตด้านบนของรูปแบบ 140.85 การเคลื่อนไหวต่อจากนั้นจะอยู่ในความกว้างของรูปแบบปัจจุบัน

ขอบเตระยะเวลาใน M5 และ M15 อาจจะมีตำแหน่งการเข้าใช้งานที่ผิดพลาดมากยิ่งขึ้น

Open chart in a new window

รูปแบบกราฟจุดสองยอด (Double Top)
was formed on 21.04 at 05:59:59 (UTC+0)
signal strength 1 of 5

รูปแบบกราฟจุดสองยอด (Double Top) GOLD M5

รูปแบบการย้อนตัว รูปแบบกราฟจุดสองยอด (Double Top) ได้ถูกสร้างขึ้นมาใน GOLD M5 คุณลักษณะ: ขอบเขตด้านบน 3384.89; ขอบเขตด้านล่าง 3377.85; ความกว้างของกราฟรูปแบบนี้คือ 687 จุด

ขอบเตระยะเวลาใน M5 และ M15 อาจจะมีตำแหน่งการเข้าใช้งานที่ผิดพลาดมากยิ่งขึ้น

Open chart in a new window
หากไม่สะดวกคุยในตอนนี้
ระบุคำถามไว้ได้ใน แชท.
 

Dear visitor,

Your IP address shows that you are currently located in the USA. If you are a resident of the United States, you are prohibited from using the services of InstaFintech Group including online trading, online transfers, deposit/withdrawal of funds, etc.

If you think you are seeing this message by mistake and your location is not the US, kindly proceed to the website. Otherwise, you must leave the website in order to comply with government restrictions.

Why does your IP address show your location as the USA?

  • - you are using a VPN provided by a hosting company based in the United States;
  • - your IP does not have proper WHOIS records;
  • - an error occurred in the WHOIS geolocation database.

Please confirm whether you are a US resident or not by clicking the relevant button below. If you choose the wrong option, being a US resident, you will not be able to open an account with InstaSpot anyway.

We are sorry for any inconvenience caused by this message.