


Dolzarb patternlar

Двойное дно
сформирован 31.03 в 13:01:22 (UTC+0)
сила сигнала 3 из 5
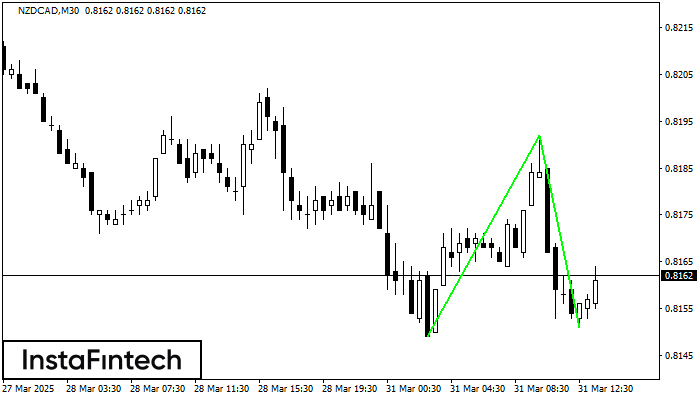
Сформирована фигура «Двойное дно» на графике NZDCAD M30. Характеристика: Уровень поддержки 0.8149; Уровень сопротивления 0.8192; Ширина фигуры 43 пунктов. В случае пробоя уровня сопротивления можно будет прогнозировать изменение тенденции, где первая точка фиксации прибыли находится на расстоянии 41 пунктов.
- Все
- Все
- Bullish Rectangle
- Bullish Symmetrical Triangle
- Bullish Symmetrical Triangle
- Double Bottom
- Double Top
- Double Top
- Triple Top
- Triple Top
- Triple Top
- Triple Top
- Все
- Все
- Покупка
- Продажа
- Все
- 1
- 2
- 3
- 4
- 5
Triple Bottom
сформирован 07.04 в 03:10:11 (UTC+0)
сила сигнала 1 из 5

The Triple Bottom pattern has been formed on GOLD M5. It has the following characteristics: resistance level 3009.08/2992.38; support level 2976.74/2972.63; the width is 3234 points. In the event
The M5 and M15 time frames may have more false entry points.
Открыть график инструмента в новом окне
Inverse Head and Shoulder
сформирован 07.04 в 03:00:19 (UTC+0)
сила сигнала 1 из 5

According to the chart of M5, NZDCAD formed the Inverse Head and Shoulder pattern. The Head’s top is set at 0.7904 while the median line of the Neck is found
The M5 and M15 time frames may have more false entry points.
Открыть график инструмента в новом окне
Bearish Symmetrical Triangle
сформирован 07.04 в 02:45:25 (UTC+0)
сила сигнала 1 из 5
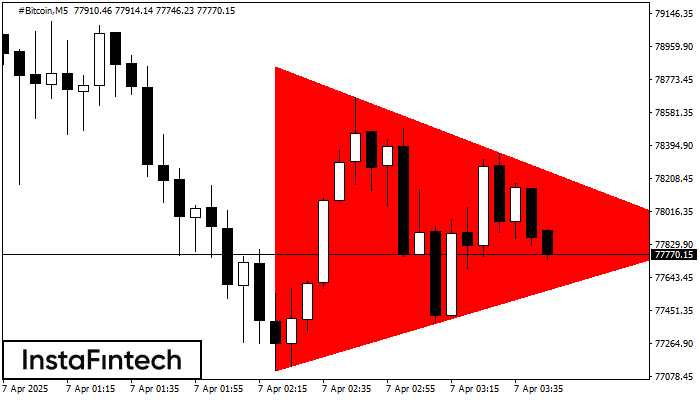
According to the chart of M5, #Bitcoin formed the Bearish Symmetrical Triangle pattern. Trading recommendations: A breach of the lower border 77111.27 is likely to encourage a continuation
The M5 and M15 time frames may have more false entry points.
Открыть график инструмента в новом окне
