


Huyền thoại trong nhóm InstaSpot!
Huyền thoại! Bạn nghĩ rằng đó là lời nói khoa trương? Nhưng chúng ta nên gọi một người đàn ông như thế nào, người đã trở thành người châu Á đầu tiên giành chức vô địch cờ vua thế giới lứa tuổi thiếu niên năm 18 tuổi và người trở thành Đại kiện tướng Ấn Độ đầu tiên năm 19 tuổi? Đó là khởi đầu cho con đường khó khăn đến danh hiệu Vô địch Thế giới của Viswanathan Anand, người đàn ông đã trở thành một phần của lịch sử cờ vua mãi mãi. Giờ đây, một huyền thoại nữa trong nhóm InstaSpot!


Borussia là một trong những câu lạc bộ bóng đá danh giá nhất nước Đức, đã nhiều lần chứng minh cho người hâm mộ thấy: tinh thần thi đấu và sự lãnh đạo chắc chắn sẽ dẫn đến thành công. Giao dịch theo cách mà các chuyên gia thể thao chơi trò chơi: tự tin và chủ động. Giữ một "đường chuyền" từ Borussia FC và dẫn đầu với InstaSpot!
4h
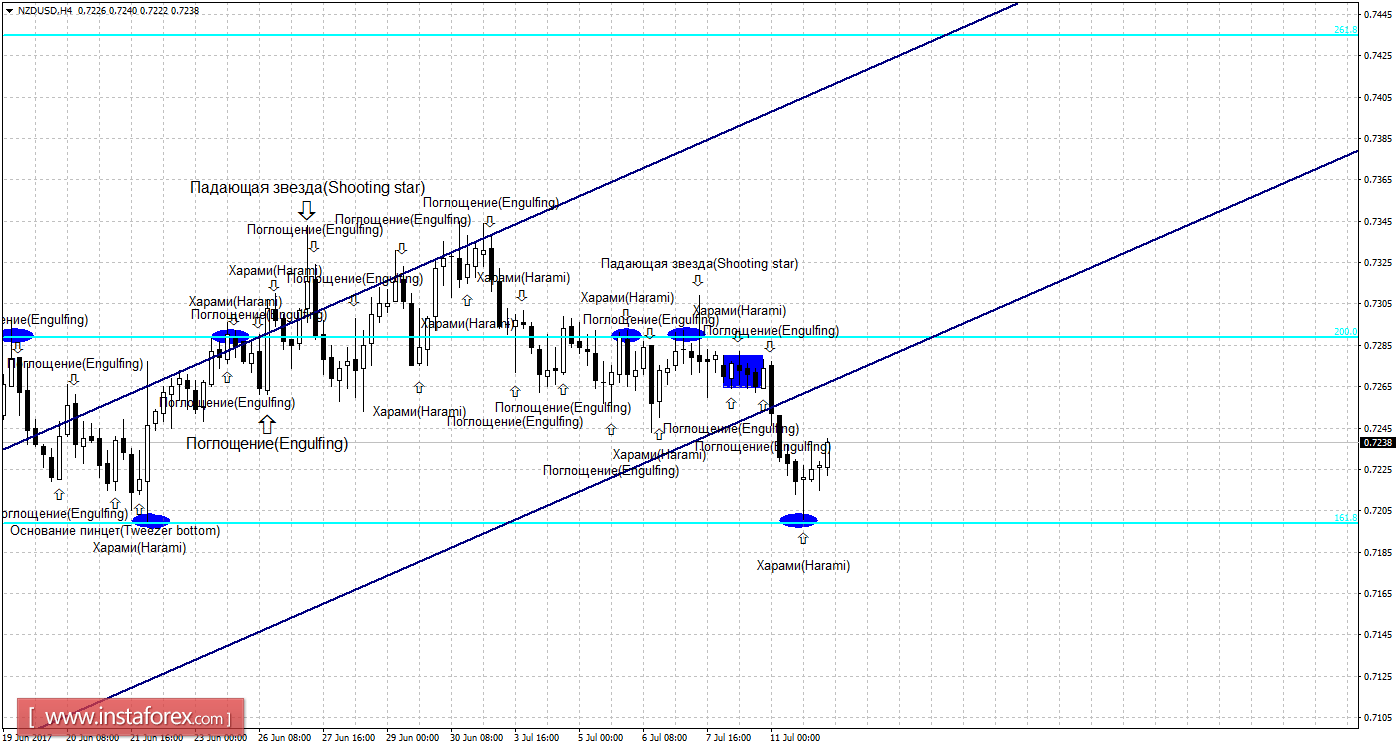
Prices hang up from the correction level of 161.8% to 0.7199 and the formation of bullish Harami candlestick pattern are working in favor of the New Zealand currency.
The expansion started in the direction of the corrective level of 200.0% - 0.7289.
The NZD / USD consolidated below the correction level of 161.8% which will increase chances of further decline in prices towards the next corrective level of 100.0% - 0.7053.
The Fibonacci grid is placed on extremes from April 24, 2017 and May 11, 2017.
Daily
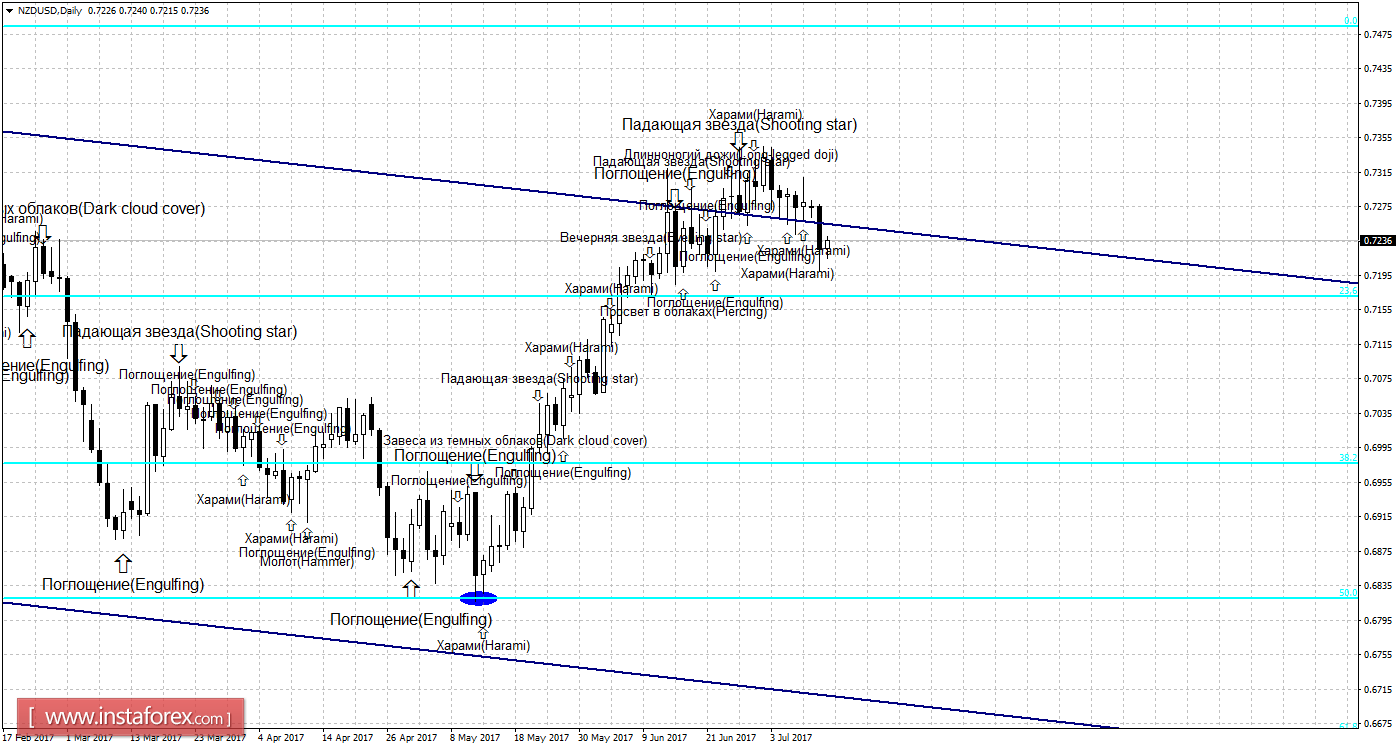
The weakening of the NZD / USD pair continues as shown the 24-hour chart towards the direction of the correction level of 23.6% - 0.7172. The pair's retracement level of 23.6% is expected to allow traders make a move favorable to the New Zealand currency and some development approaching the correction level of 0.0% - 0.7484. The formation of the bullish candle pattern will also work inclined with the initial growth of the pair. The pair consolidated below the Fibo level of 23.6% had increased chances of continuing the decline towards the next correction level of 38.2% - 0.6977.
The Fibonacci grid is located on extremes from August 24, 2015 and September 8, 2016.
Specification:
Weak candle formations will be marked with plain text and a smaller size of arrows.
Strong candle formations will be marked with bold text and a larger size of arrows.
*Phân tích thị trường được đăng tải ở đây có nghĩa là để gia tăng nhận thức của bạn, nhưng không đưa ra các chỉ dẫn để thực hiện một giao dịch.
InstaSpot analytical reviews will make you fully aware of market trends! Being an InstaSpot client, you are provided with a large number of free services for efficient trading.


