


Đội ngũ của chúng tôi có hơn 7,000,000 thương nhân!
Hàng ngày chúng tôi làm việc cùng nhau để cải thiện việc giao dịch. Chúng tôi nhận được kết quả cao và luôn tiến lên phía trước.
Sự công nhận của hàng triệu thương nhân trên toàn thế giới là sự đánh giá tốt nhất cho công việc của chúng tôi! Bạn đã đưa ra quyết định của mình và chúng tôi sẽ làm mọi thứ cần thiết để đáp ứng mong đợi của bạn!
Chúng ta cùng với nhau sẽ là một nhóm tuyệt vời!
InstaSpot. Tự hào làm việc cho bạn!


Diễn viên, nhà vô địch mùa giải UFC 6 và là người hùng thật sự!
Người tự mình làm nên tất cả. Người đàn ông đáng kể học hỏi.
Bí mật đằng sau thành công của Taktarov là sự cố gắng liên tục hướng tới mục tiêu.
Hãy khai phá tất cả các mặt tài năng của bạn!
Khám phá, thử, thất bại - nhưng không bao giờ dừng lại!
InstaSpot. Câu chuyện thành công của bạn bắt đầu từ đây!
The economic calendar commonly lacks high-impact economic data on Monday. Yesterday was no exception. The US, the UK, and the EU did not release any economic reports.
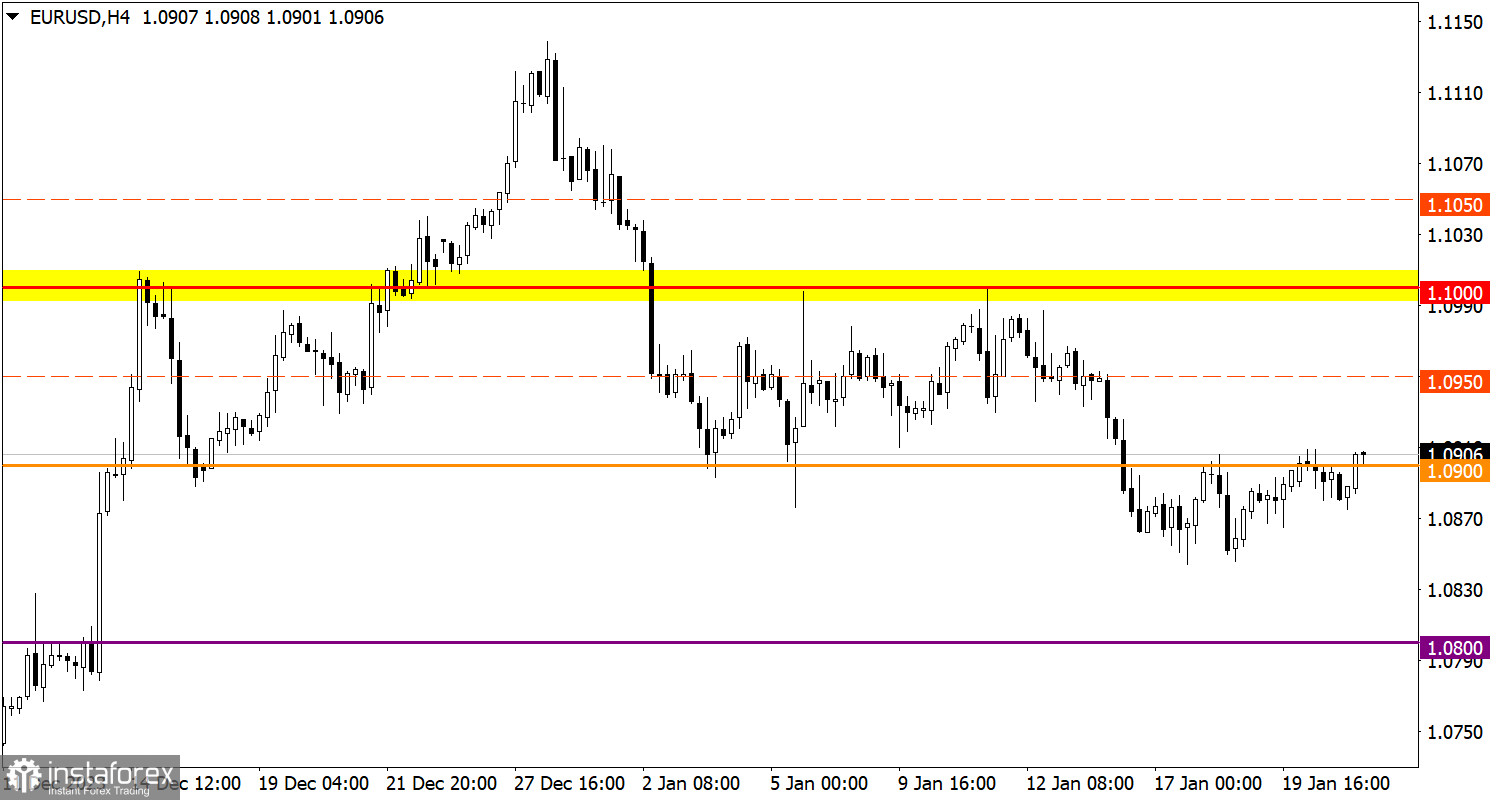
The EUR/USD pair has been moving around the 1.0900 level for the third day in a row with low trading activity. The level of 1.0850 serves as a variable support on the path of sellers. At this level, there was a reduction in short positions on EUR/USD.
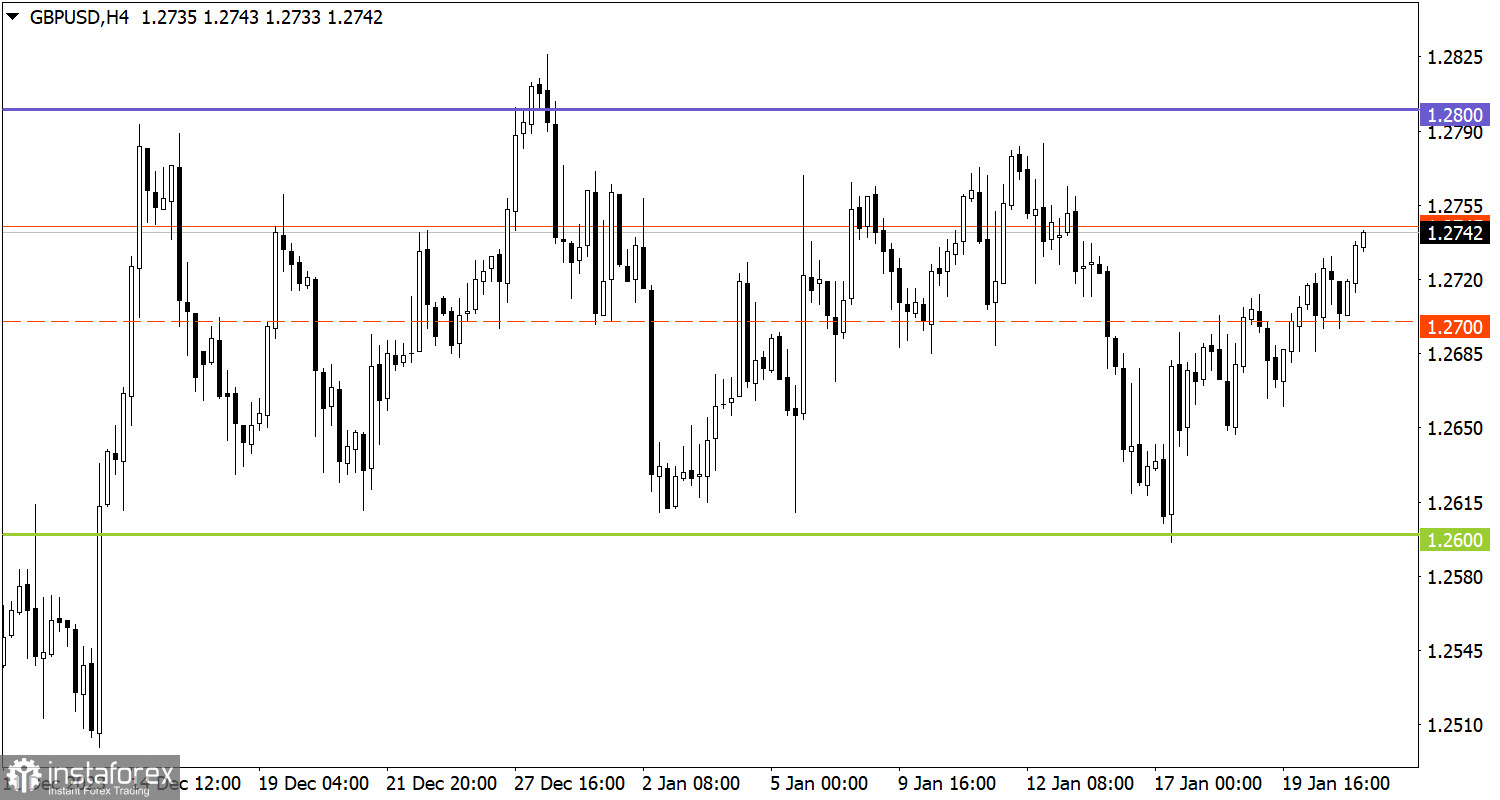
The GBP/USD currency pair is trading within the sideways channel of 1.2600/1.2800, consistently approaching the defined borders. At the moment, we see the consolidation above the average level of 1.2700, which indicates an increase in long positions on the range-bound market.

Today the economic calendar is equally empty as on Monday. No macroeconomic data will be released in the US, the UK, and the EU.
Consolidation of the price above 1.0900 during the day may lead to an increase in the volume of long positions in the direction towards 1.1000. As for the bearish scenario, it will come into play if the price drops below 1.0850.
In this situation, we may go ahead trading within the borders of the sideways channel. We reckon the instrument could approach the upper border at 1.2800.
However, we should not forget that the range-bound market is a temporary pattern, which leads to the accumulation of trading forces and abundant attention from speculators. As a result, the instrument will gain a certain momentum and break any of the borders. When the flat market is over, the price will indicate a further direction in the market. For this reason, you should always consider the breakout strategy.
The candlestick chart type consists of graphic rectangles in white and black with lines at the top and bottom. With a detailed analysis of each individual candle, you can see its characteristics relative to a particular time frame: opening price, closing price, maximum and minimum price.
Horizontal levels are price coordinates relative to which a price may stop or revered its trajectory. In the market, these levels are called support and resistance.
Circles and rectangles are highlighted examples where the price developed. This color highlighting indicates horizontal lines that may put pressure on the price in the future.
Up/down arrows are guidelines for possible price direction in the future.
*Phân tích thị trường được đăng tải ở đây có nghĩa là để gia tăng nhận thức của bạn, nhưng không đưa ra các chỉ dẫn để thực hiện một giao dịch.
InstaSpot analytical reviews will make you fully aware of market trends! Being an InstaSpot client, you are provided with a large number of free services for efficient trading.


