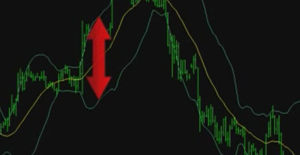
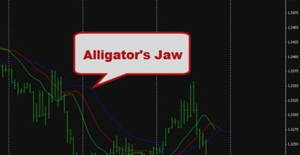
Bollinger Bands technical indicator which shows the range and speed of price change, allowing to cover the most part of market instrument price movement. Bollinger Bands give buy or sell signal, but do not determine further direction of market instrument. Learn more about the indicator functioning from our video record.
The video guide below is about indicators which you can use for technical analysis. This type of analysis increases the efficiency of your long-term trading.
Indicators are main tools of technical analysis based on study of the historical price data applying statistical and mathematical methods to the charts. Technical indicators are able to make all the calculations for trader and help forecast the price movement.
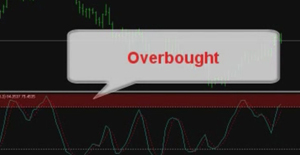
Indicators can be divided into two main groups: trend indicators that define the current market trend and oscillators that show the dynamics of sideways trend development.
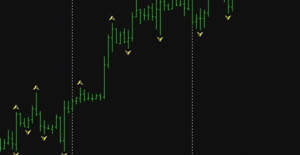
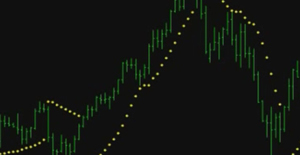
The video instruction can guide you through the extended list of technical indicators and help set and change their parameters.
Please note that indicator signals are only recommendations as the accurate forecast of the price movement is impossible. In this regard we recommend using several analytical tools for making final decision.


